Download presentation
Presentation is loading. Please wait.

1
THE SCAR MET-READER PROJECT Steve Colwell and John Turner British Antarctic Survey

2
READER Reference Antarctic Data for Environmental Research To put together a data set, that is as complete and accurate as possible, of monthly mean surface and upper air data from stations south of 50°.

3
Criteria for inclusion in READER A lot of stations have been operated in the Antarctic over the years; many for quite short periods. The record from a station must extend for 25 years, although not necessarily in a continuous period, or be currently in operation and have operated for the last 10 years. We chose to use only data from year-round stations.

4
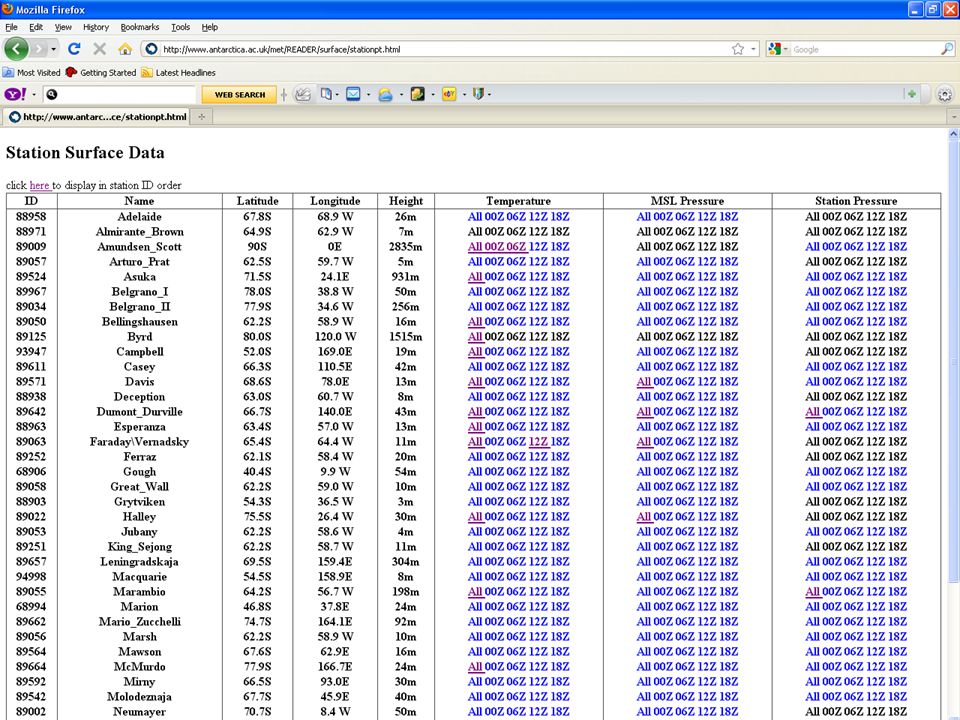
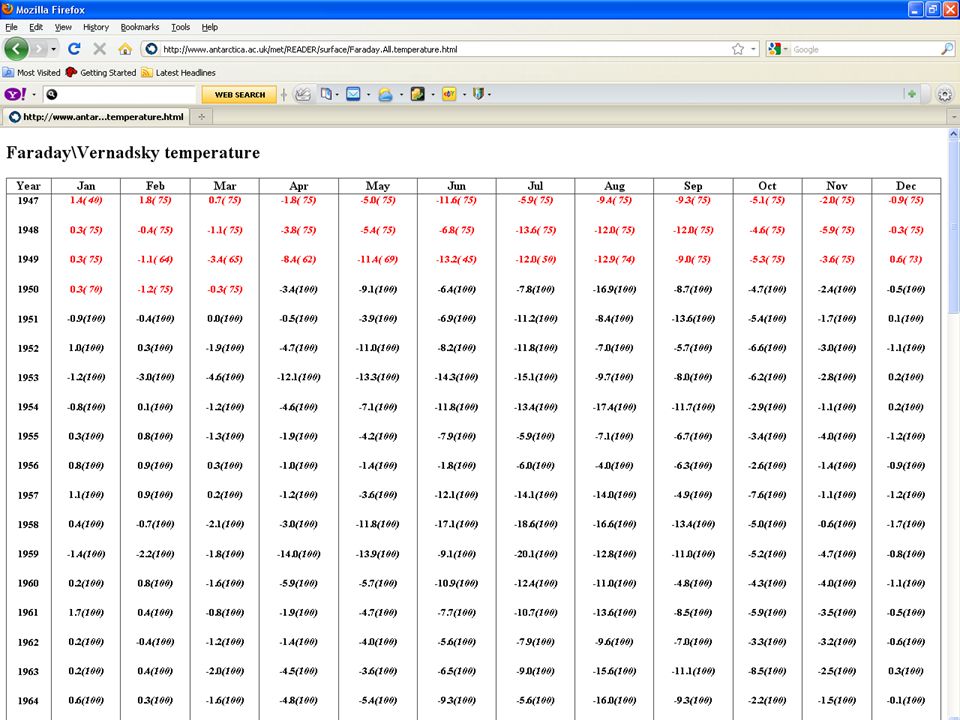
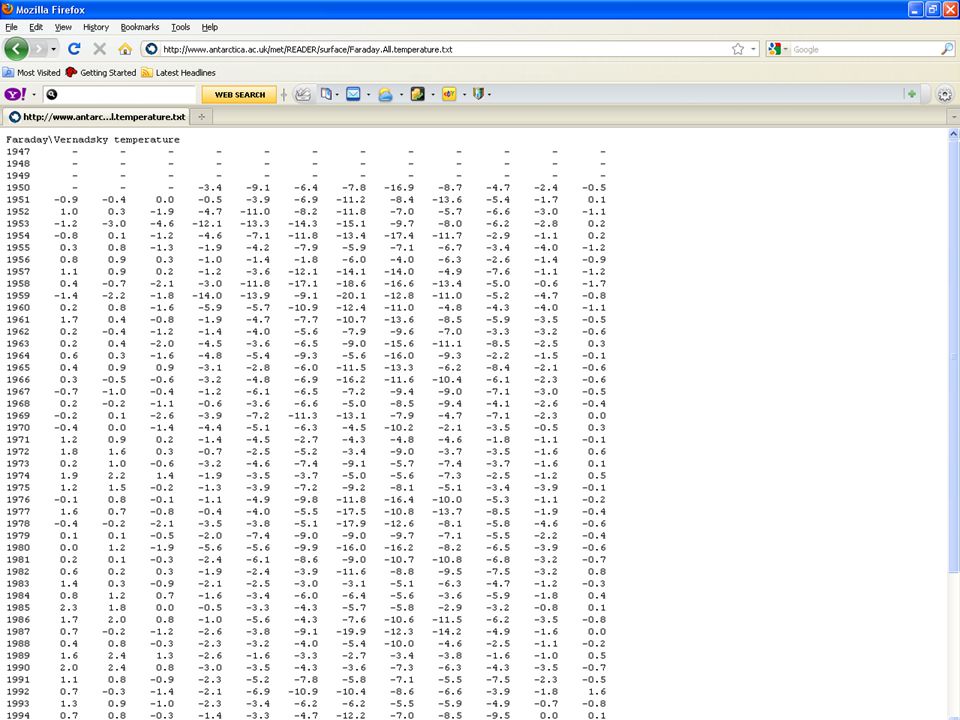
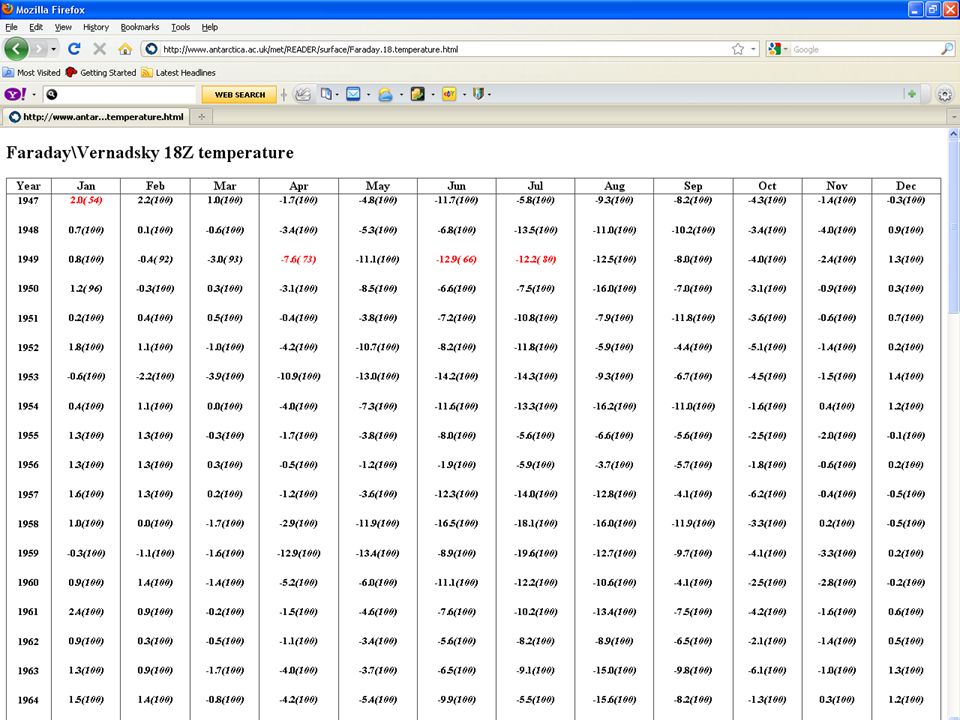
READER Data Upper air data – Height, temperature, wind speed and wind direction for 850, 700, 500, 300, 200, 150, 100, 50Hpa Surface data – Station pressure, MSL pressure, temperature, wind speed and wind direction calculated from 6 hourly synoptic observations. – 5 tables for each calculated from all, and just 00, 06, 12, 18UTC

5
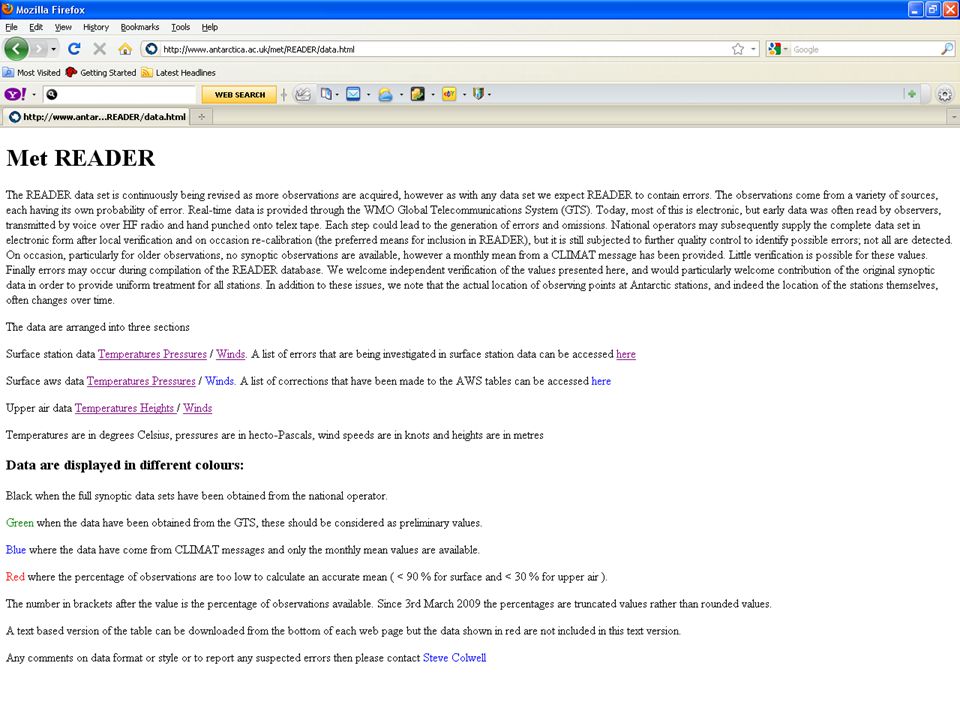
Priority of data for staffed stations Mean of 6 hourly data from national operator if 90% or more is available and no gap greater than 2 consecutive days. Mean of 6 hourly data from GTS. CLIMAT message data. Mean from national operator where source is unknown

6
Priority of data for upper air Means computed from individual ascents obtained from national operator. More than 10 ascents must be available and no gap greater than 4 consecutive days. Means computed from individual ascents obtained from GTS. A mean derived from CLIMAT TEMPS

7
Quality control Data from the national operators were intensively quality controlled. Range check were carried out on the data and also software was written to look for jumps and spikes in the data. Monthly mean were calculated and any values that were more than 3 standard deviations from the mean were looked at.

8
When suspect data was identified the national operator was contacted to ask them to look at the suspect data and go back to the original records and send corrected values back. If it was not possible to get a corrected value then the data point was deleted. Monthly means were then calculated from the 6 hourly data.

9
WMO definition for mean temperature At synoptic stations the daily value is calculated as the average of the three- hourly or six-hourly readings. At most ordinary climatological stations equipped with thermometers only, the maximum and minimum temperatures are read; in this case, a useful approximation to the daily mean temperature is given by the average of these two temperatures.

23
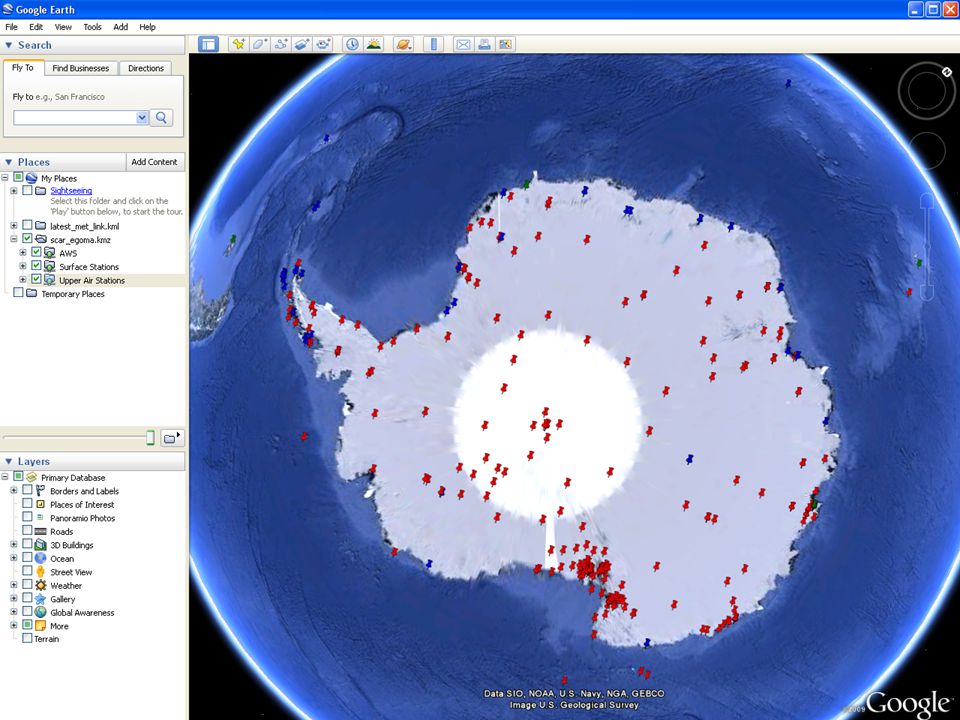
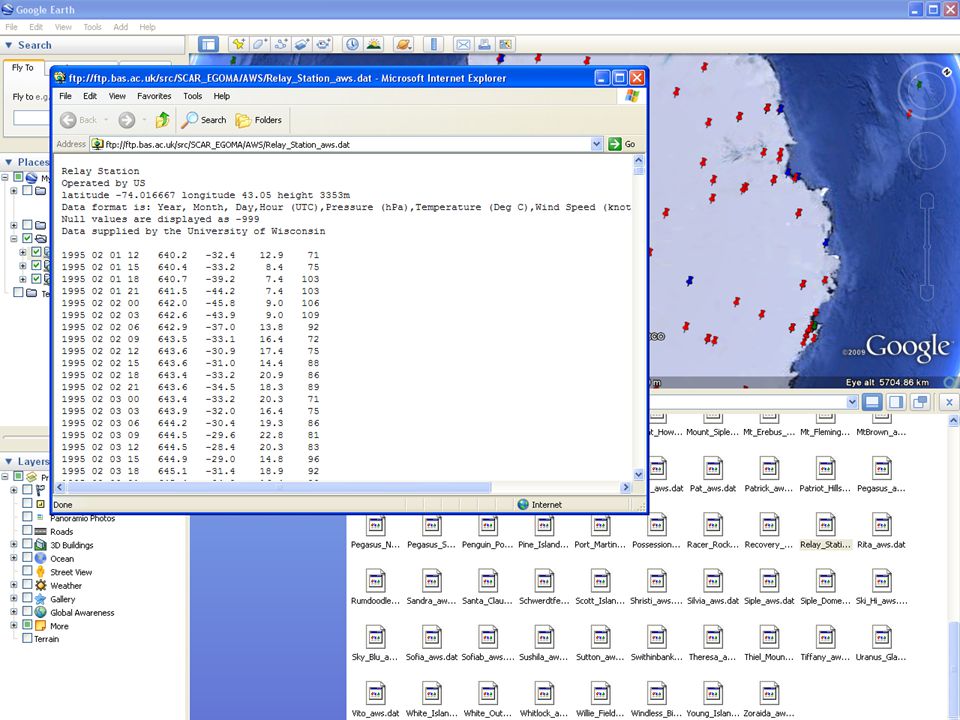
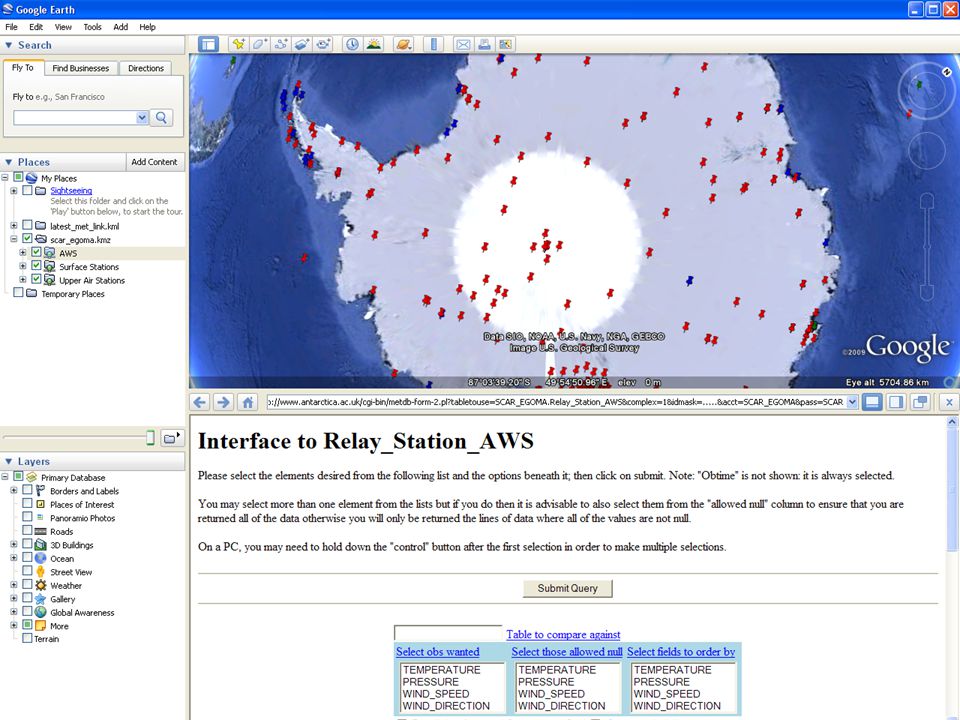
Future developments Set the system up as embedded Google Earth so that it can be viewed via a web browser Setup an interface that will allow the used to enter a date period that they are inferted in that will then produce a KMZ file for them that shows what locations have data for that period.

24
Questions src@bas.ac.uk www.antacrica.ac.uk http://www.antarctica.ac.uk/met/READER/ ftp://ftp.bas.ac.uk/src/SCAR_EGOMA/scar_egoma.kmz

Similar presentations