Download presentation
Presentation is loading. Please wait.

1
D A C B z = 20m z=4m Homework Problem A cylindrical vessel of height H = 20 m is filled with water of density to a height of 4m. What is the pressure at: (i) point A located on the bottom at the center, (ii) at point B located at the bottom of the vessel but at the right sidewall; (iii) at point C at the surface of the water; (iv) at point D located at the vessel sidewall 2 m above the bottom.? Take the atmospheric pressure as.
 point A located on the bottom at the center, (ii) at point B located at the bottom of the vessel but at the right sidewall; (iii) at point C at the surface of the water; (iv) at point D located at the vessel sidewall 2 m above the bottom.. Take the atmospheric pressure as..")
3
II. Using for an approximation of seawater density at what depth would the pressure double from that of atmospheric pressure? A decibar is.1 bar, how much would you have to go beneath water for the pressure to increase 1 dbar pressure above atmospheric pressure. Can you see why some oceanographers use decibars instead of meter to indicate depth? Homework Problems Continued.

4
Equation of State Note that which shows that seawater is compressible! The compressibility of seawater allows sound to be propagated at a speed In this equation p is taken relative to atmospheric pressure From and the above equation can you show that ? Homework Problem How much does pressure contribute to seawater density at the bottom of an ocean of depth 4 km?

5
Homework Problem Calculate the and draw the density profile, z and buoyancy profile N(z) for the temperature profile shown. Assume a constant salinity of S = 35.5 psu. Repeat your calculation for S = 36 psu. Comment on how the N profile changes when the salinity changed. 100m 1km 4km

7
-

8
Homework: von Arx (1962) has suggested that to understand conservation of potential vorticity we consider what happens to a barrel of water as it moves around the earth. Take the shaded circles as the initial rest position ( no relative vorticity) of a barrel of water. Assume that the shape and volume of the barrel is constant, i.e. H, r constant. Using the concept of conservation of potential vorticity explain what happens to the relative vorticity and its direction of rotation (clockwise, counterclockwise) as it moves along paths # 1,2,3,4,5,6,7. #1 #2 #3 #4 #5 #7 #6
 of a barrel of water. Assume that the shape and volume of the barrel is constant, i.e. H, r constant. Using the concept of conservation of potential vorticity explain what happens to the relative vorticity and its direction of rotation (clockwise, counterclockwise) as it moves along paths # 1,2,3,4,5,6,7. #1 #2 #3 #4 #5 #7 #6.")
9
3 D Turbulence: Navier Stokes Equation (no gravity, no coriolis effect) Examples: tidal channel flow, pipe flow, river flow, bottom boundary layer) I. Acceleration II. Advection (non-linear) III. Dynamic Pressure IV. Viscous Dissipation Homework: Use Dimensional analysis to show that the Reynolds number, Re, goes as the ratio of term II to the term IV. Interpret the Reynolds number criteria for the onset of turbulence.
 III. Dynamic Pressure IV. Viscous Dissipation Homework: Use Dimensional analysis to show that the Reynolds number, Re, goes as the ratio of term II to the term IV. Interpret the Reynolds number criteria for the onset of turbulence..")
10
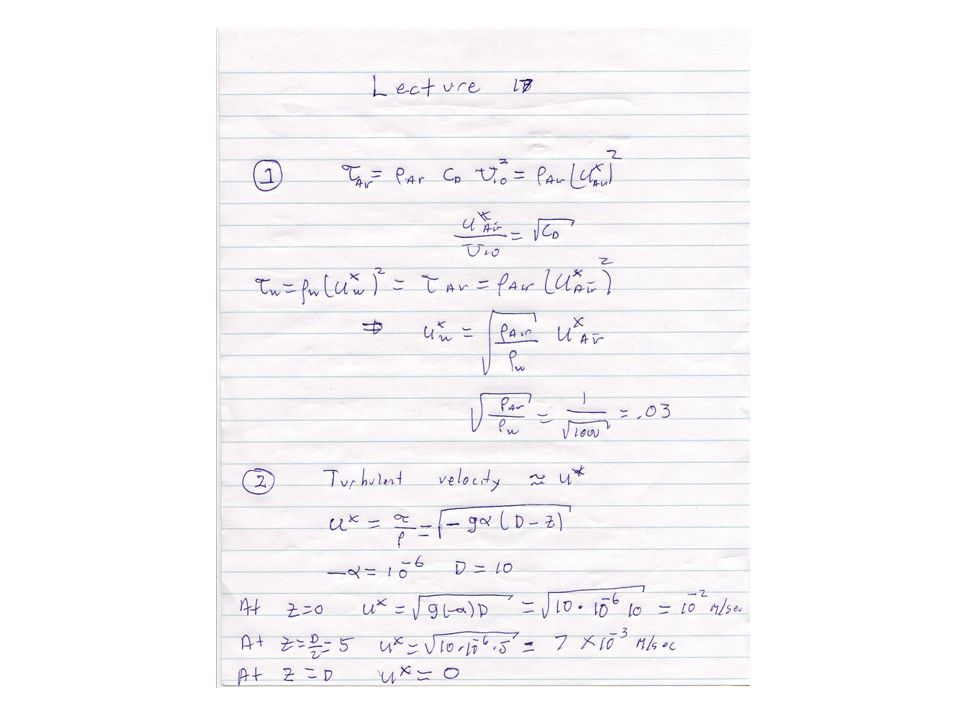
Empirical Formula for Wind Stress Drag Coefficient Homework: Why do we use in the formula above? Why not use the wind speed right at the surface? Explain. Why do you think that the drag coefficient has a large change In value when the wind speed (at 10m) increases above ? Hint: what would cause a sudden increase in air turbulence with an increasing wind speed?
 increases above . Hint: what would cause a sudden increase in air turbulence with an increasing wind speed .")
11
Example : Steady State Channel flow with a constant surface slope, (No wind) Role of Bottom Stress z = 0 z = D Bottom Surface z Flow Direction Why? Bottom Stress Surface Stress Stress x Example : Steady State Channel flow with a constant surface slope, (No wind)
.")
12
Typical Values Homework: For the example just given using estimate the turbulent velocity at the surface, at the mid depth, and on the bottom. Where is the turbulence a maximum? Homework: Suppose in the example above the surface was completely flat but there was wind with a speed of at a height of 10 m above the surface. Calculate the stress and estimate the turbulent velocity: (a) at the surface; (b) at mid depth; ( c ) on the bottom.
 at the surface; (b) at mid depth; ( c ) on the bottom..")
13
Back to constant surface slope where example we found that Note we have used the fact that Homework: For the example just given using estimate the mean velocity at the surface, at the mid depth, and on the bottom. z = 0 z = D If we use the eddy viscosity assumption with constant k

14
Mixed Layer/Surface Ekman Layer (turbulent) Pycnocline (Intermittently turbulent) Bottom Boundary Layer (turbulent log layer) Bottom Ekman Layer (turbulent) Vertical Distribution of Turbulence Explain what produces turbulence in the: (a) mixed layer; (b) the bottom boundary layer; in the pycnocline
 Pycnocline (Intermittently turbulent) Bottom Boundary Layer (turbulent log layer) Bottom Ekman Layer (turbulent) Vertical Distribution of Turbulence Explain what produces turbulence in the: (a) mixed layer; (b) the bottom boundary layer; in the pycnocline")
15
z =0 m z =50 m z =800 m z =1000 m z =100 m Homework: A certain marginal sea of depth 1000m has a density and velocity profile as shown in the figure below with values given in the table to the right. Assume that the density and velocity vary linearly within each “layer”. Calculate and sketch the and profiles. Where should there be turbulence?

18
Homework: The wind blows along a coastal channel of depth 40 meters with a speed of 10 m/sec. If the drag coefficient between the water and air is found to be 2.5 x 10 -3, (a) calculate the stress induced by the wind on the water surface; (b) calculate the in air friction velocity, the in water friction velocity; © what is the stress on the bottom of the water? (d) what is the stress at a depth of 10m, 20,30? (d) what is the shear at the surface, at a depth of 10m, on the bottom? Assume that the flow acts as a log “layer “ layer in the lower 5 m of the water, above which.
 calculate the stress induced by the wind on the water surface; (b) calculate the in air friction velocity, the in water friction velocity; © what is the stress on the bottom of the water. (d) what is the stress at a depth of 10m, 20,30. (d) what is the shear at the surface, at a depth of 10m, on the bottom. Assume that the flow acts as a log layer layer in the lower 5 m of the water, above which..")
22
Homework: Using the concept of geostrophy and a level of no motion at z = 600m to estimate the surface current of the Gulf Stream. Use the dotted section for your calculation.

Similar presentations


>")

 Boundary Layer is.>")
.>")


Barometric – Coastal water response to low pressure at center of storm B) Wind stress – frictional drag.>")


. we have,. and At the.>")