Download presentation
Presentation is loading. Please wait.

1
Tropical Cyclones and Climate Change – PhD Project Results from HiGEM High Resolution Climate Model Ray Bell Supervisors – Prof. Pier Luigi Vidale, Dr. Kevin Hodges and Dr. Jane Strachan MO TCWG – 21st Jul

2
Will there be a change in TC activity (location, intensity, frequency, lifetime, structure) with climate change? How does this change depend on resolution? How well are the governing mechanisms represented in climate models and how does resolution affect their representation? What is the role of teleconnections - Possible ENSO changes on NAtl TC activity? [What is the role of coupling with the ocean?] PhD questions

3
Models NH May - Nov HadGAM N96 -135km HiGEM N144 - 90km NUGAM N216 - 60km

4
HiGEM CTRL TC variability 150 years => 5x30. Min, Max, and Avg at each point

5
Lack of re-curving in NWPAC - SSTs in the NWPAC? HiGEM CTRL TC activity compared to Obs

6
HiGEM CTRL TC frequency Reduced ATL activity – Cold bias? - ATL known to the most sensitive basin to SST (Emanuel, 2008) Max intensity ~cat 3 (50m/s +) Obs from http://www.wunderground.com/blog/JeffMasters/archive.html?year=2011&month=04 Using IBTrACS (not same criteria as tracking) http://www.wunderground.com/blog/JeffMasters/archive.html?year=2011&month=04 * att is attain 850hPa wind speed >20m/s dataset TC/yrNHATLWPACEPACNIND att 5x30 years ctrl 76.2 (74.5- 78.7) 56.9 (55.4- 58.3) 6.2 (5.2- 7) 4.4 (3.7- 5.2) 33.4 (31.7- 34) 29.5 (28.5- 30.3) 19.2 (17.8- 20.2) 10.3 (9.6- 10.8) 7.1 (6.8- 7.2) 4.9 (4.6- 5.2) Obs (83-07) 6312.328.316.65.8
 Max intensity ~cat 3 (50m/s +) Obs from year=2011&month=04 Using IBTrACS (not same criteria as tracking) year=2011&month=04 * att is attain 850hPa wind speed >20m/s dataset TC/yrNHATLWPACEPACNIND att 5x30 years ctrl 76.2 ( ) 56.9 ( ) 6.2 (5.2- 7) 4.4 ( ) 33.4 ( ) 29.5 ( ) 19.2 ( ) 10.3 ( ) 7.1 ( ) 4.9 ( ) Obs (83-07)")
7
Change in track densities with increased CO 2

9
Change in frequency ATL shows largest decrease EPAC shows an increase at 2xCO 2 NIND shows an increase - attain 850hPa wind speed 20m/s gives a + change in TC freq. Suggesting largest decrease of TCs from weaker storms * att is attain 850hPa wind speed >20m/s dataset TC/yrNHATLWPACEPACNIND % change For ctrl att 30yr 2xCO2 -5-24-20-9-7-391126 30yr 4xCO2 -19-11-51-43-21-17-40-25524

10
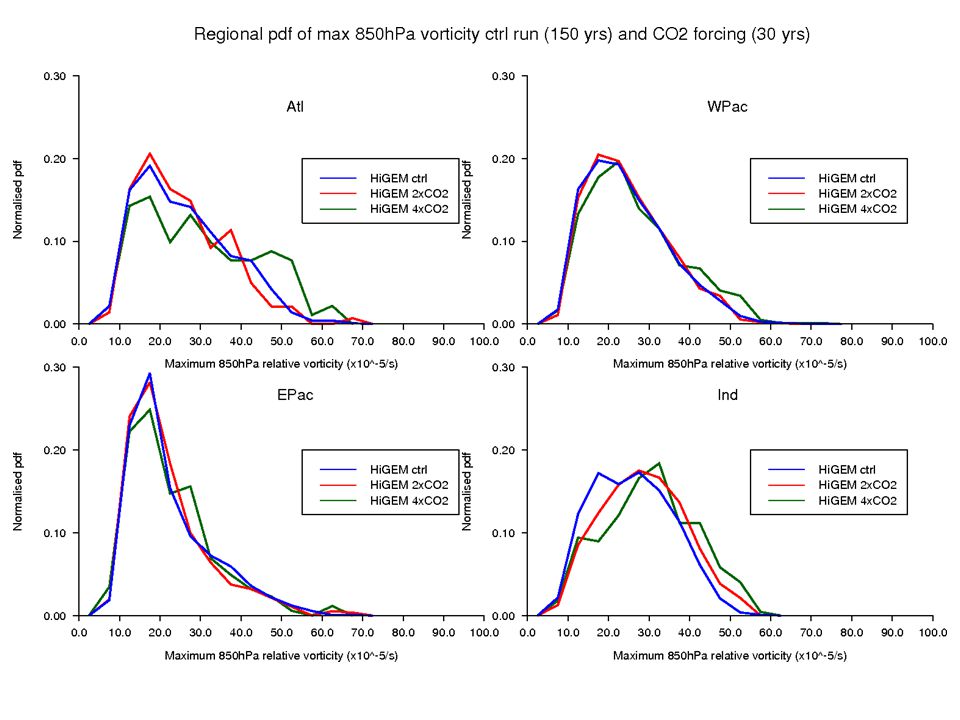
Change in intensity (850hPa wspeed)
")
11
Regional change of 850hPa wspeed

12
Change in duration

13
Regional Change in duration

14
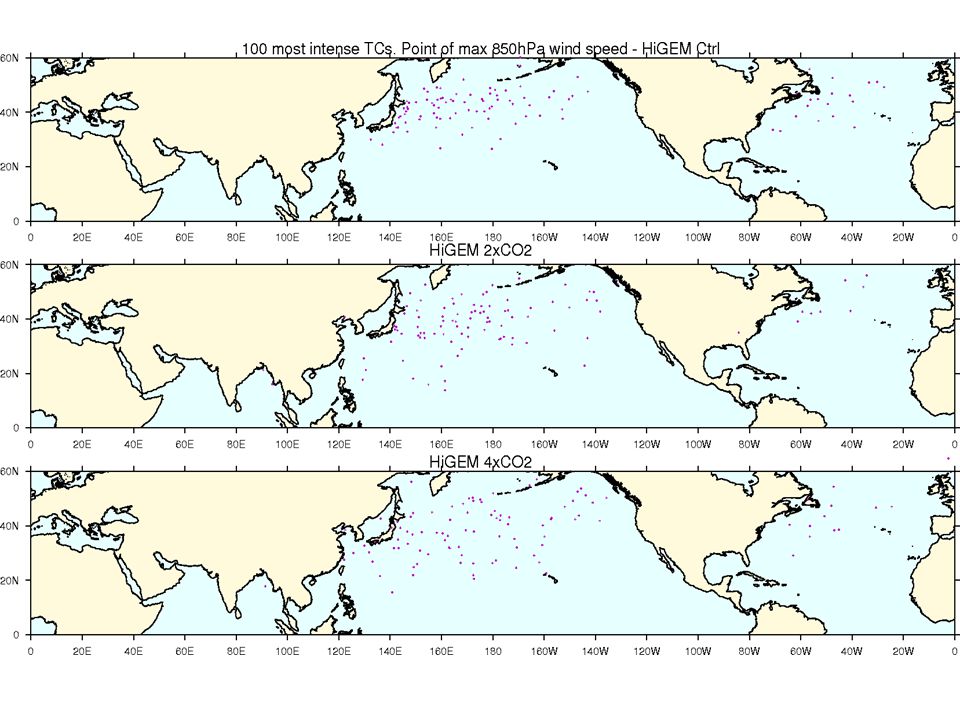
Change in structure 100 most intense TCs at most intense 4xCO2 Earth relative winds Below 35 o N NH 2xCO2 10 o radius 850hPa Avg 30 yr ctrl

15
Future work Attribution of change in TC activity - SST – Local vs. Remote changes in each basin - Wind shear Changes in SH ENSO influence on NATL activity - compare IBTrACS and re- analysis to HiGEM present day simulation and future climates) Model HiGEM SSTs on HadGAM to compared different model resolutions
 Model HiGEM SSTs on HadGAM to compared different model resolutions.")
16
References Bengtsson, L., Hodges, K. I., and Esch, M. (2007). Tropical cyclones in a T159 resolution global climate model: comparison with observations and re-analysis. Tellus A, 59, 396–416. Hodges, K.I. (1995) Feature tracking on a unit sphere Mon. Weath. Rev. 123, pp 3458-3465. Questions/Comments/Suggestions ?
. Tropical cyclones in a T159 resolution global climate model: comparison with observations and re-analysis. Tellus A, 59, 396–416. Hodges, K.I. (1995) Feature tracking on a unit sphere Mon. Weath. Rev. 123, pp Questions/Comments/Suggestions .")
18
Uncertainties in future dynamical and thermodynamical changes due to anthropogenic warming in the tropics. Change in precursors (e.g. AEWs...) Current trends and attribution Natural variability (Pielke et al, 2005) vs. Climate change (Webster et al, 2005) Limitations in the quality and availability of data (Kossin et al, 2007) Theory (Emanuel, 1987) and high resolution modelling studies (Knutson et al. 2004; Oouchie et al. 2006) predict TCs will become more intense. Little theory explaining the change in TC frequency - likely to become less frequent in a warmer world. Previous studies
 Current trends and attribution Natural variability (Pielke et al, 2005) vs. Climate change (Webster et al, 2005) Limitations in the quality and availability of data (Kossin et al, 2007) Theory (Emanuel, 1987) and high resolution modelling studies (Knutson et al. 2004; Oouchie et al. 2006) predict TCs will become more intense. Little theory explaining the change in TC frequency - likely to become less frequent in a warmer world. Previous studies.")
19
Global increase in TC intensities of 2-11% (surface wind speed). (3-21% decrease in central pressure) by 2100 (A1B scenario) (Knutson et al, 2010) Decrease in globally averaged frequency of TCs by 6-34% - Weakening of the tropical circulation (Increase in dry static stability) (Sugi, 2002) - Increase in q* causes larger X m (moist S in middle of troposphere and that of the BL), therefore takes longer to moisten mid-trop where intensification can occur (Emanuel, 2008) More robust decrease in the SH – smaller increase in SST and increase wind shear (Vecchi, 2007; Zhao et al, 2009) Increase of 20% in precipitation rate within 100km of the storms centre (Knutson et al, 2010) Higher resolution models needed to pick up a warming related intensification (<60km) (Bengtsson et al, 2007) Previous studies
 by 2100 (A1B scenario) (Knutson et al, 2010) Decrease in globally averaged frequency of TCs by 6-34% - Weakening of the tropical circulation (Increase in dry static stability) (Sugi, 2002) - Increase in q* causes larger X m (moist S in middle of troposphere and that of the BL), therefore takes longer to moisten mid-trop where intensification can occur (Emanuel, 2008) More robust decrease in the SH – smaller increase in SST and increase wind shear (Vecchi, 2007; Zhao et al, 2009) Increase of 20% in precipitation rate within 100km of the storms centre (Knutson et al, 2010) Higher resolution models needed to pick up a warming related intensification (<60km) (Bengtsson et al, 2007) Previous studies.")
20
Previous studies (Knutson et al, 2010) Large Regional Uncertainties
 Large Regional Uncertainties")
21
T42 ξ 850 (0 o -60 o N)– Reduce noise. Comparison of different spatial resolution data Minimum lifetime of 2 days and no constraint on the minimum displacement distance. Capture more of TC lifecycle Cyclogenesis (0-20 o N over land, 0-30 o N over ocean) Coherent vertical structure and warm core Max T63 vor at each level from 850hPa to 250hPa Intensity threshold T63 ξ 850 > 6x10 -5 s -1, ξ 850 – ξ 200 > 6x10 -5 s -1, for at least 1 day (4 x 6hr) Associate full res data with tracks Wind speed must attain 20m/s at 850hPa (change in slightly more intense TCs) Statistical packages Investigating multiple level warm core testing and cyclogenesis over the ocean – hope to cut out monsoon depressions TRACK Hodges (1995); Bengstsson et al. (2007)
 Coherent vertical structure and warm core Max T63 vor at each level from 850hPa to 250hPa Intensity threshold T63 ξ 850 > 6x10 -5 s -1, ξ 850 – ξ 200 > 6x10 -5 s -1, for at least 1 day (4 x 6hr) Associate full res data with tracks Wind speed must attain 20m/s at 850hPa (change in slightly more intense TCs) Statistical packages Investigating multiple level warm core testing and cyclogenesis over the ocean – hope to cut out monsoon depressions TRACK Hodges (1995); Bengstsson et al. (2007).")
22
Jane’s previous work

23
Change in Atl track densities

24
Change in genesis densities

25
Change in lysis densities

31
Change in structure 100 most intense TCs at most intense 4xCO2 System relative winds Below 35 o N 2xCO2 10 o radius 850hPa Avg 30 yr ctrl

Similar presentations