Download presentation
Presentation is loading. Please wait.

1
1 Academic Rankings of Universities in the OIC Countries April 2007 April 2007

2
2 Aims of Ranking Assessing OIC universities among themselves; Assessing the gap between OIC universities and world- class universities; Increasing competitiveness among OIC universities; Assessing academic excellence of each university; Helping determine best practices; Giving impetus to science and research policy in national settings; Contributing to the intensification of scientific relations and wider-reaching networking of national and international research.

3
3 Need for Ranking Ranking lists have for some time been in great demand all over the world. Recently, the concept of ranking has gained more prominence. Therefore, new efforts to rank excellence are continually coming to the market, and are likely to increase in number and use in the foreseeable future. Given the fact that there are only a few universities in the OIC region ranked in the top 500 world class universities in the last decade, there is a need to improve the current situation in this respect.

4
4 Ranking as a Method for Identification of Excellence The core of ranking is establishing comparability among institutions. Comparability is based on methods and techniques which are intended to identify the best research institutions in their overall performance and respective fields, using objective and transparent data.

5
5 Ranking as a Matter of Competition Competition is the rationale underlying ranking efforts. In fact, competition has been a characteristic element in science and humanities for centuries, both for those directly involved in research and for their institutions. Ranking has taken on new forms in the last few decades, and in this process, has also been increasingly used as a new dimension of measuring quality in the higher education sector.

6
6 Ranking At International Scale Since research does not stop at national boundaries, internationality is an integral element of research. Hence, we should try to convert this international aspect into a “measurable quantity” in order to say something meaningful about the prime parameter “excellence.”

7
7 Competitive Strategy for Excellence Institutions need to watch their competitors in; managing their activities, positioning themselves in the higher education sector, prioritizing where to focus, building competences for future, and allocating resources. Ranking requires universities to develop competitive strategies to gain and sustain competitive advantage in the higher education sector.

8
8 Ranking of Universities Coverage and Data

9
9 Universities in OIC member countries; Those published articles in the period 2001-2006 in journals covered by the Institute for Scientific Information (ISI) in: Science Citations Index (SCI), Science Citations Index Expanded (SCI-EXPANDED), and Social Science Citation Index (SSCI) Coverage
 in: Science Citations Index (SCI), Science Citations Index Expanded (SCI-EXPANDED), and Social Science Citation Index (SSCI) Coverage")
10
10 Coverage 49 of 57 member countries; Data for Afghanistan, Comoros, Djibouti, Guinea, Guinea Bissau, Ivory Coast, Maldives, and Niger were not available. Either there was; No information for universities, or No articles matching the criteria. 323 of 1799 universities for single-factor rankings. 85 of 323 universities for ranking by the composite index. Number of faculty members were not available for the rest.

11
11 Data ISI Web of Knowledge Number of articlesBy universities Number of citationsBy countries SESRTCIC Web Search List of universities by country Number of faculty members Any other data is from the database of the Centre or our calculations.

12
12 Characteristics of Data Internationally comparable data Objective quantitative criteria Open to verification

13
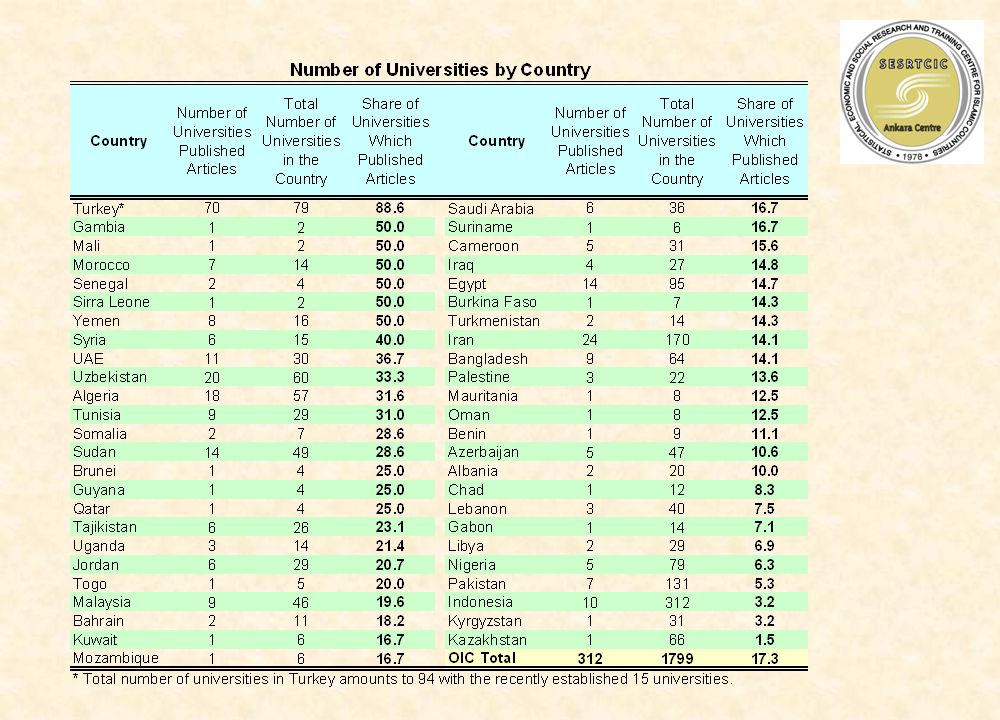
13 General Statistics Ranking of Universities

14
14 OIC and the World

19
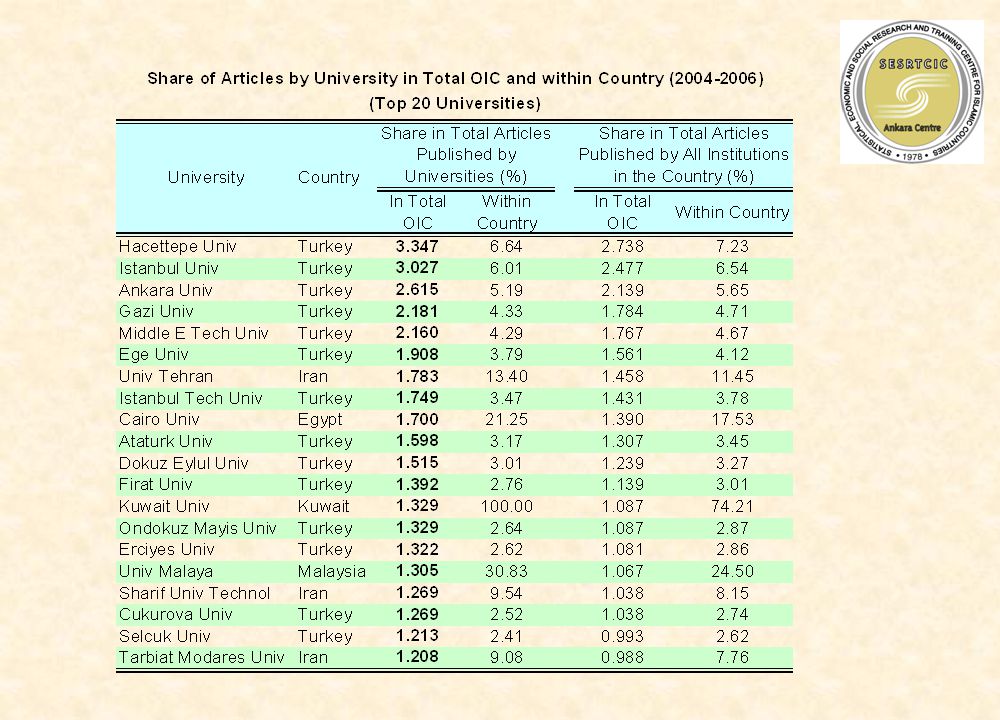
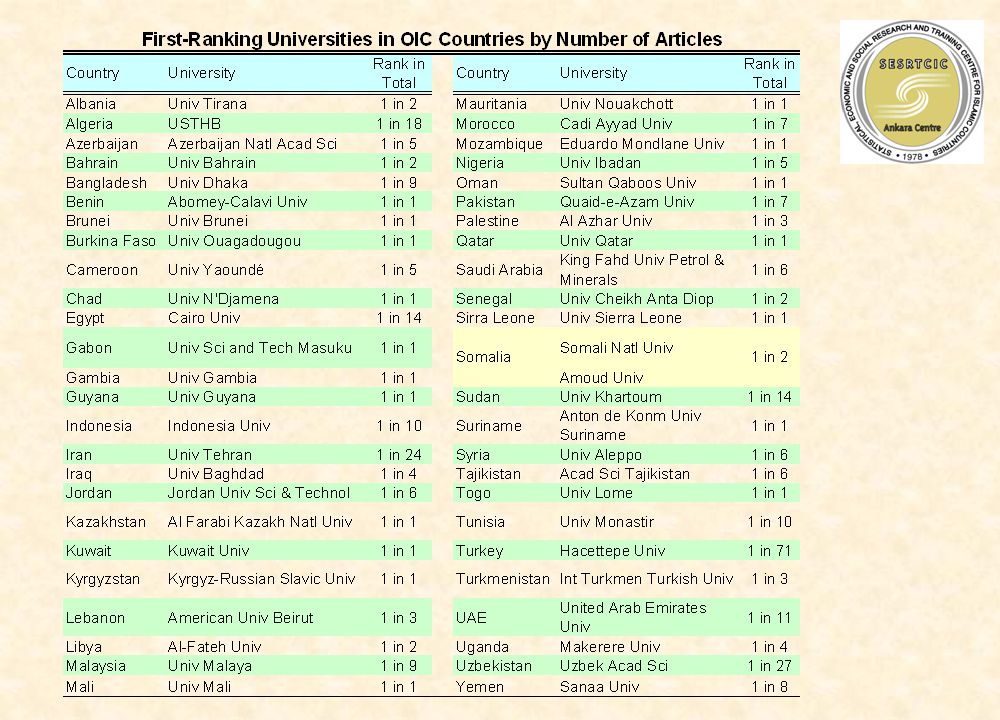
19 Rankings of Universities Single-Factor Rankings of Universities

20
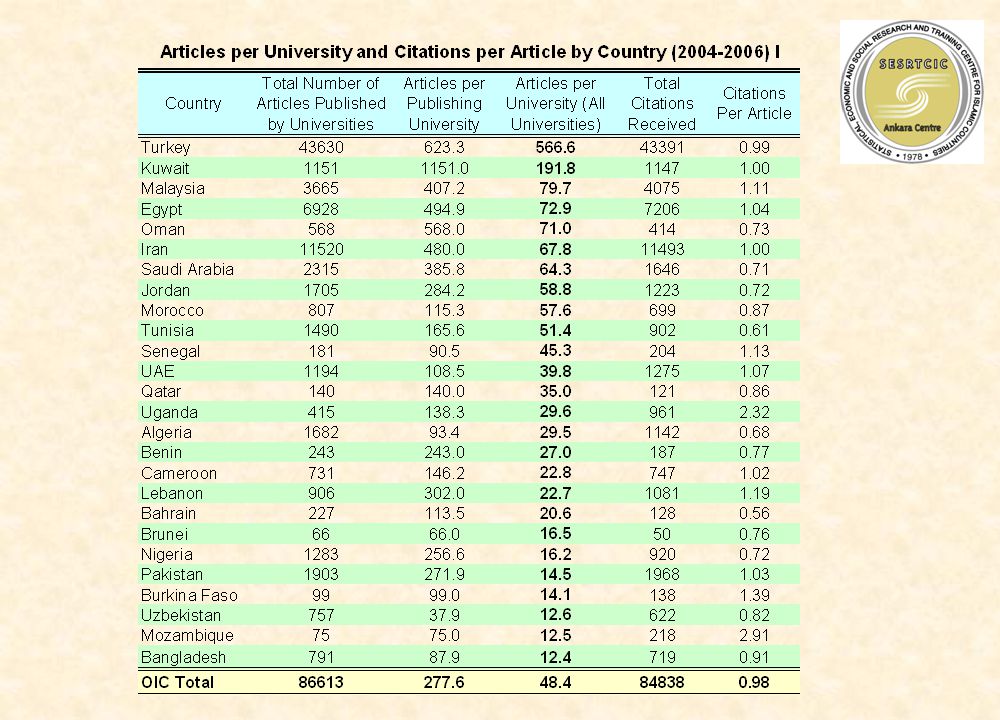
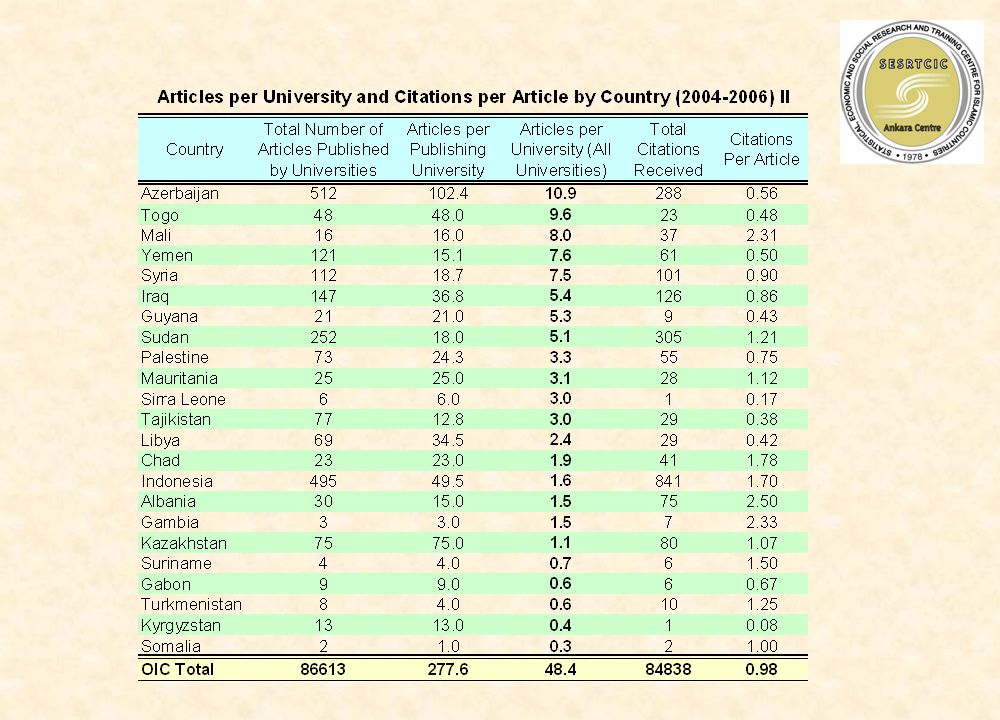
20 Methodology Single-Factor Rankings Ranking by Number of Articles Universities are ranked with respect to the number of articles they published in 2004-2006. Ranking by Citations per Article (CpA) Universities are ranked against these two criteria in the following section.
 Universities are ranked against these two criteria in the following section..")
22
Distribution of Top 20 Universities by Country (By NoA) Regional Distribution of Top 20 Universities (By NoA)
 Regional Distribution of Top 20 Universities (By NoA)")
24
Distribution of Top 20 Universities by Country (By CpA) Regional Distribution of Top 20 Universities (By CpA)
 Regional Distribution of Top 20 Universities (By CpA)")
27
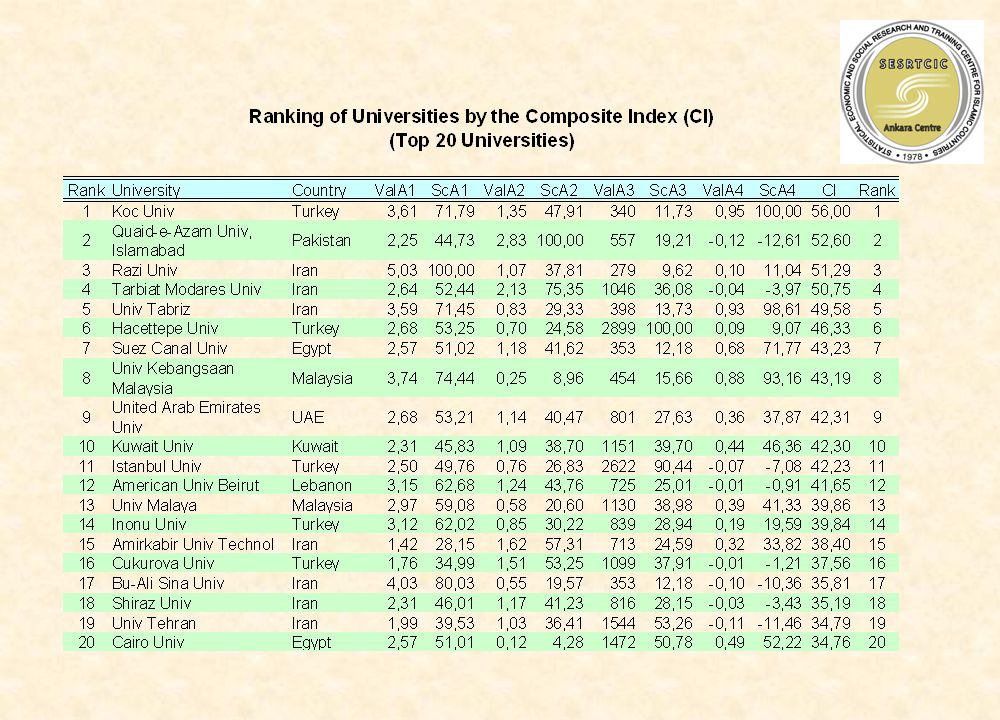
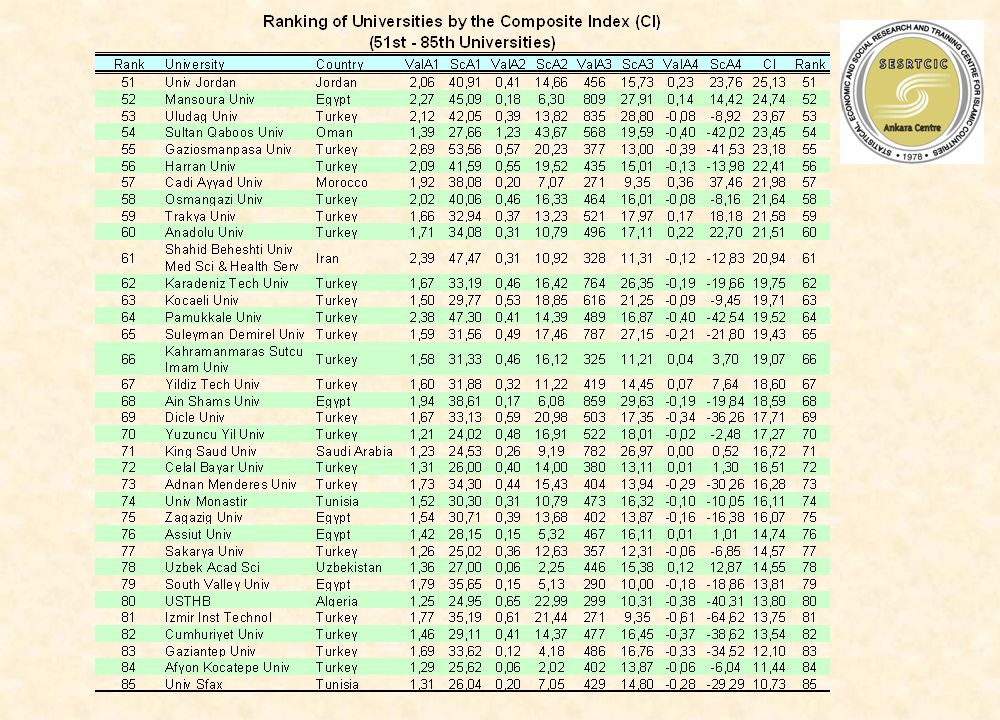
27 Ranking by Composite Index Rankings of Universities

28
28 Methodology Ranking by Composite Index (CI) Indicators: Weight in the Index (%) Research Quality (A1) 35 Measures the quality of the performed research. Research Performance (A2) 35 Measures the research performance of faculty members. Research Volume (A3) 18 Measures the volume of research production of faculty members. Rate of Growth for Research Quality (A4) 12 Measures the progress shown relative to the entire OIC in a 3-year period with respect to the quality of the performed research (A1).
 35 Measures the research performance of faculty members. Research Volume (A3) 18 Measures the volume of research production of faculty members. Rate of Growth for Research Quality (A4) 12 Measures the progress shown relative to the entire OIC in a 3-year period with respect to the quality of the performed research (A1)..")
29
29 Measuring the Composite Index (CI) CI = ∑ Indicators (Weight of the indicator) x (Score of the indicator)
 CI = ∑ Indicators (Weight of the indicator) x (Score of the indicator)")
30
30 Measuring the Composite Index (CI)
")
32
Distribution of Top 20 Universities by Country Regional Distribution of Top 20 Universities

34
Distribution of Top 50 Universities by Country Regional Distribution of Top 50 Universities

36
Distribution of the 85 Universities by Country Regional Distribution of the 85 Universities

37
37 Some Statistical Findings Concerning the Rankings Statistical analysis via Correlation Coefficient provides useful information on the relationship between the variables of interest. Correlation Coefficient (r): A statistic that gives a measure of how closely two variables are related. A statistical measure of the extent to which variations in one variable are related to variations in another. A value of +1 indicates a perfectly positive relationship, –1 indicates a perfectly inverse relationship, and 0 indicates no relationship between the variables.
: A statistic that gives a measure of how closely two variables are related. A statistical measure of the extent to which variations in one variable are related to variations in another. A value of +1 indicates a perfectly positive relationship, –1 indicates a perfectly inverse relationship, and 0 indicates no relationship between the variables..")
38
38 Correlation between GDP and the Distribution of top 20 Universities by Country A value of 0.70797 indicates that there is strong positive relationship between the share of countries in the ranking of top 20 universities and their GDP. This close relationship holds true also for the share of countries in the ranking of top 50 and 85 universities. Correlation coefficient for these rankings and GDP is 0.70651 and 0.70728, respectively. GDP at current prices in billions of US Dollars. These findings suggest that the higher the GDP is, the bigger is the share in top rankings.

39
39 Role of SESRTCIC By collecting quantitatively reliable information and data on agreed research and education indicators of universities, the SESRTCIC aims to be the independent body of ranking for the OIC member countries in two ways: OIC LEVEL: Ranking universities within the entire OIC region NATIONAL LEVEL: Ranking universities within each OIC member country

Similar presentations