Download presentation
Presentation is loading. Please wait.

1
Bioinformatics Summer School Young-Jin Lee Iowa State University

3
PROTEOME PROTEIN + GENOME PROTEOME Complete complements of proteins to “complete set of Genes” in a given organism

4
Genome Proteome Transcriptome Metabolome System Biology Technically each part Technically challenging

5
Proteomics represents the effort to establish the identities, quantities, structures, and biochemical and cellular functions of all proteins in an organism, organ, or organelle, and how these properties vary in space, time, or physiological state. MCP 1.10 pg 675 National Research Council Steering committee

6
Proteomics can be defined as the qualitative and quantitative comparison of proteomes under different conditions to further unravel biological processes. - Expasy.org, “What is proteomics” In the wonderland of complete sequences, there is much that genomics cannot do, and so the future belongs to proteomics: the analysis of complete complements of proteins. Proteomics includes not only the identification and quantification of proteins, but also the determination of their localization, modifications, interactions, activities, and ultimately, their function. - Stanley Fields, “Proteomics in Genomeland”, science, 291, 1221- 1224, 2001 Proteomics: a technology-driven and technology-limited discovery science - Kelvin H. Lee, trends in biotechnology, 19, 217, 2001

7
Time line indicating the convergence of different technologies and resources into a proteomic process. S.D.Peterson & R.H.Aebersold, Nature Genetics, 2003 Top-down approach Targeted analysis PTM analysis

8
Why do we need to know about proteins when we can easily measure gene expression? Proteins are the functional products of genes –There can be many proteins for every gene alternative splicing posttranslational modifications –Protein – Protein interactions are key –Genes do not tell us spatial and temporal distribution of proteins in a cell Gene expression is not often correlated with protein expression patterns! –Yeast study (Gygi et al. 1999, Molec. Cell Biol. 19: 1720) transcripts change proteins constant proteins change - transcripts constant
 transcripts change proteins constant proteins change - transcripts constant.")
9
One genome multiple Proteomes tagacgacct ggcccaacgc tgtgcccagt acaagaagga tggctgtgac ttcgccaaat ggcgttgtgt gctcaagatc ggcaagaaca ccccctccta ccaagctatc cttgagaatg ccaacgtact ggcacgctat gcgtccatct gccaatccca gcgcattgtg cccattgtagagcctgaggt gctgcctgat ggagatcacg accttgacag ggctcagaag gtcacagaga cagttctggc cgctgtgtac aaggcactca atgaccacca tgtcttcctg gagggcaccctcctgaagcc caacatggtg accgcaggac agtcctgctc caagaagtac aattatgagg acaacgctag agctacagtg ttggccctgt ccagaactgt gccagctgct gtccctggtgtgactttctt gtcaggaggt cagtcggagg aggatgcctc tgtcatttgg atgctatcaa caagatc

10
Genomics vs Proteomics Genomics Proteomics Species Dependent Focus is sequencing A single technology Engineering Problem A finite Number of Genes Easy Part Species Independent Cellular Functions at the Molecular level Multiple Technology Not just Engineering Infinite Number of Proteins Not Easy to Study Biological Systems, Dynamics, and Networks

11
PROTEINS vs PROTEOMES Protein: Study structure-function of a single protein at a time Proteome: Study structure-function of multiple proteins at the same time in the complex celluar environment OLD 1.One protein at a time 2.One gene-one protein 3.Characterization 4.Edman 5.Low throughput 6.Multiple step purification 7.Function Purification 8.--- 9.--- New 1.Multiple proteins (>10~100) 2.One gene-multiple proteins 3.Identification 4.Mass Spectrometry 5.High throughput 6.One or two step purification 7.In the context of network and flux 8.Sensitive to cellular perturbation 9.Senstive to enviromental changes
 2.One gene-multiple proteins 3.Identification 4.Mass Spectrometry 5.High throughput 6.One or two step purification 7.In the context of network and flux 8.Sensitive to cellular perturbation 9.Senstive to enviromental changes")
12
Science, 2001

13
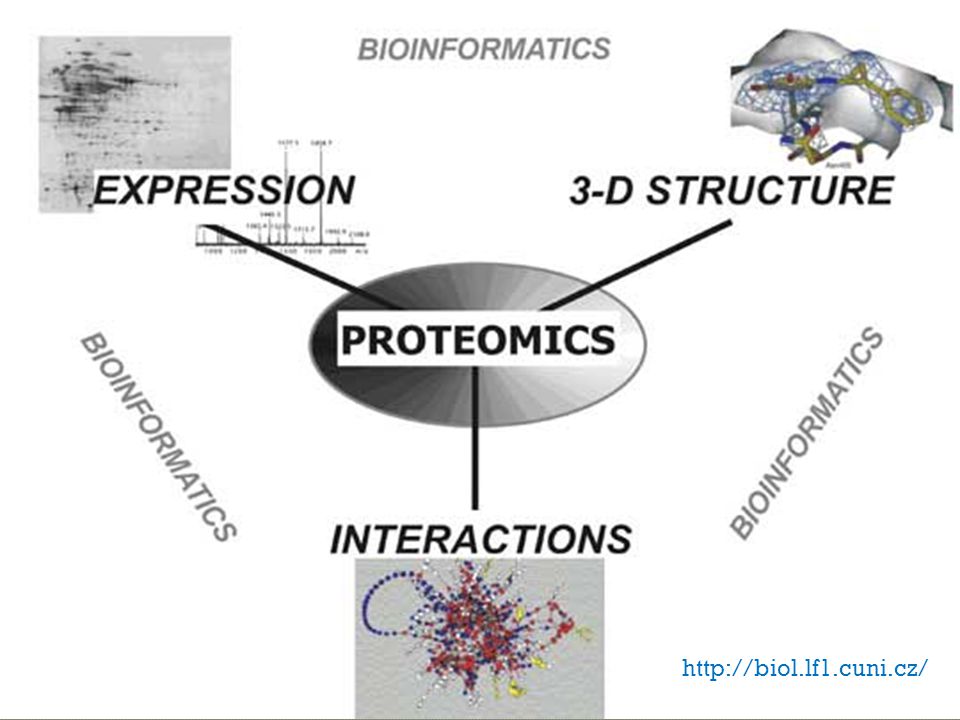
http://biol.lf1.cuni.cz/
14
Analytical Protein/Peptide separation technologies Mass Spectrometers Database Software/Bioinformatics

15
Protein Mining Identifying as many proteins as possible in a sample. Protein Profiling Differences in protein expression between 2 or more samples With or without relative quantitation Protein Interaction analysis Non-covalent complexes Post Translational Modification analysis

17
Two main ways Finger Printing Determine m/z of the Peptide ions only (MS) Product Ion Scanning Determine the m/z of the peptide ions (parent ions) Fragment peptide ions Determine m/z of Fragments (Product Ions)
 Product Ion Scanning Determine the m/z of the peptide ions (parent ions) Fragment peptide ions Determine m/z of Fragments (Product Ions)")
18
Take a Pure Protein of Interest 1d or 2d gel spot HPLC fraction Digest with a Specific Protease Trypsin Analyze peptides with a Mass spectrometer Usually MALDI-TOF, but it can be any type as long as the mass is accurate. Pros: Very Fast, Easy, Cheap

19
NH2COOHKRRKKRKR 300.12 da 312.56 da 418.56 da 551.52 da 718.23 da 407.39da Digestion with trypsin

20
Compare peptide mass list from all the proteins in the database of given species.

21
You need a mass spectrometer capable of reasonable accurate masses 50 ppm MALDI with DE and a reflector Genome must be pretty small Yeast or smaller for good results Works almost exclusively for single protein only.

22
Digest Protein with tyrpsin Determine the m/z of a peptide ion MALDI, ESI Isolate the peptide ion from any other ions (inside the mass spectrometer) Fragment the peptide ion Determine mass of Fragments Obtain AA sequence data from fragments
 Fragment the peptide ion Determine mass of Fragments Obtain AA sequence data from fragments")
23
Roepstorff Nomenclature for Possible Peptide Fragments NH 2 C H R 1 C O H N CH R 2 C O H N CH R 3 C O H N CH COOH R 4 y 3 y2 y1 b1 b2 b3

24
Val Phe Gly Lxx Lxx Asp Glu Asp Lys b8b8 b7b7 b6b6 b5b5 b2b2 b4b4 b3b3 y8y8 y7y7 y6y6 y5y5 y4y4 y3y3 y2y2 Example MS/MS spectrum Tryptic fragment:

25
Amino acid 3LC SLC Average Monoisotopic Glycine Gly G 57.0519 57.02146 Alanine Ala A 71.0788 71.03711 Serine Ser S 87.0782 87.02303 Proline Pro P 97.1167 97.05276 Valine Val V 99.1326 99.06841 Threonine Thr T 101.1051 101.04768 Cysteine Cys C 103.1388 103.00919 Leucine Leu L 113.1594 113.08406 Isoleucine Ile I 113.1594 113.08406 Asparagine Asn N 114.1038 114.04293 Aspartic acid Asp D 115.0886 115.02694 Glutamine Gln Q 128.1307 128.05858 Lysine Lys K 128.1741 128.09496 Glutamic acid Glu E 129.1155 129.04259 Methionine Met M 131.1926 131.04049 Histidine His H 137.1411 137.05891 Phenyalanine Phe F 147.1766 147.06841 Arginine Arg R 156.1875 156.10111 Tyrosine Tyr Y 163.1760 163.06333 Tryptophan Trp W 186.2132 186.07931 Monoisotopic mass: the sum of all the lightest isotopes. Average mass: the abundance weighted sum of all the isotopes of all the elements present.

26
Can take you a very long time to “sequence” a “good” product ion spectra without a computer 30 minutes if you are good. 1-2 days to never if you are not. One experiment can generate 10,000 MS/MS spectra

27
Automated De novo sequencing Lutefisk PepNovo Peaks denovoX Peptide Sequence tags Guten-Tag Cross Correlation SEQUEST Probability Based Mascot (sort of) xTandem! OMSSA

28
Not sequencing Use the protein sequences in the database Do an in silico digest Calculate m/z of in silico peptides Match the “pattern” of masses in the mass spectrometer to the in sillico “pattern” Score the result

29
= Match!! ! NR DataBase approx 3 Million protein sequences 180 thousand tryptic peptide sequences (within error) Time = 15 seconds Low Accuracy
 Time = 15 seconds Low Accuracy.")
32
hyperscore # results log(# results) E-value=e -8.2 Generates an E-value E= # of times this would occur by chance The E-value expresses just how unlikely a greater hyperscore is. X!Tandem calculates the E-value by extrapolating the red line of the log histogram. For the example shown, a hyperscore of 83 would occur by chance where the red line crosses 83. The log of this value — the E-value — is -8.2, as shown. The E-value expresses just how unlikely a greater hyperscore is. X!Tandem calculates the E-value by extrapolating the red line of the log histogram. For the example shown, a hyperscore of 83 would occur by chance where the red line crosses 83. The log of this value — the E-value — is -8.2, as shown.

33
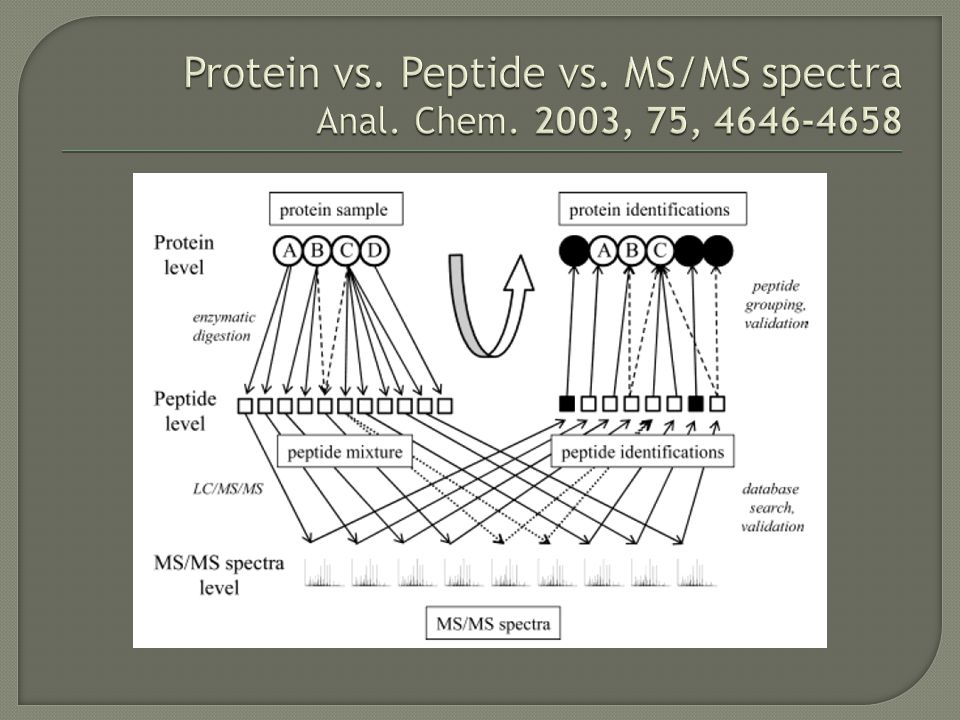
It is not trivial to reconstruct Proteins from identified peptides More than one protein may contain the same peptide sequence MS/MS spectra may match more than one sequence

35
True Negative True Positive Cutoff Score False Negative False Positive

36
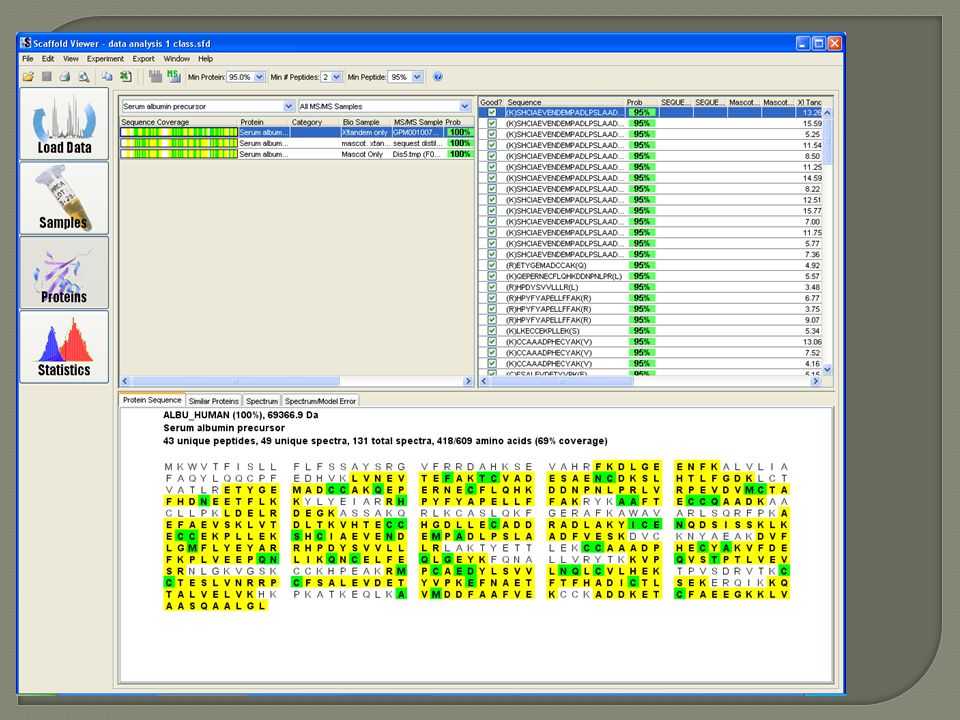
Scaffold program for data dissemination

39
Mass Spectrometry Review (2001) 20, 1
 20, 1")
40
Disadvantages Modest detection limit High abundance proteins Limited dynamic range 10 4 @ best Protein Bias (pI) Difficult to automate Labor intensive Requires many more mass spec runs Advantages High Resolution separation Can get quantitation by staining Good “snapshot” of the Proteome!
 Difficult to automate Labor intensive Requires many more mass spec runs Advantages High Resolution separation Can get quantitation by staining Good snapshot of the Proteome!")
41
FIG. 3. Protein expression profiling by 2-DE. Whole-cell lysates from nontransformed and Abelson murine leukemia virus (AMuLV)-transformed mouse fibroblasts were resolved by 2-DE, and proteins were visualized by silver staining. Differentially expressed proteins were excised from the gel and identified by MS. Paul R. Graves 1 and Timothy A. J. Haystead 1,2* Microbiology and Molecular Biology Reviews, March 2002, 66. 39-63*
-transformed mouse fibroblasts were resolved by 2-DE, and proteins were visualized by silver staining. Differentially expressed proteins were excised from the gel and identified by MS. Paul R. Graves 1 and Timothy A. J. Haystead 1,2* Microbiology and Molecular Biology Reviews, March 2002, *.")
44
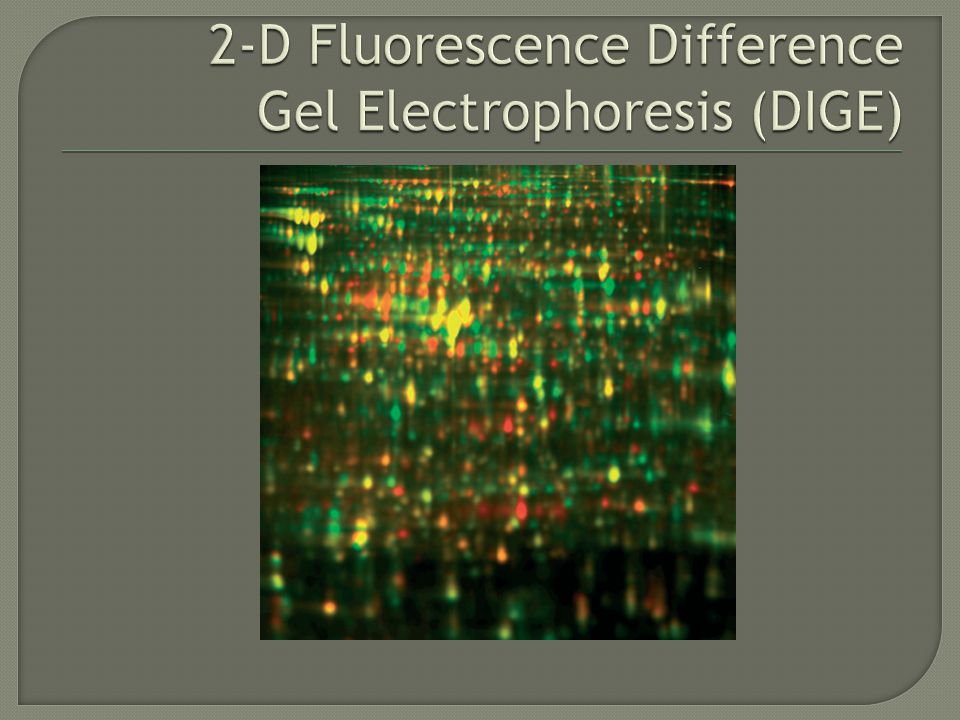
DIGE 2-D difference gel electrophoresis

45
Selective staining for phosphoprotein or glycoprotein http://www.probes.com

46
LC-MS/MS based Proteomics

47
LC-MS/MS based proteomics Advantage Can be used for any acidic or basic proteins Automation: reproducible, robust, time-saving Dynamic range Disadvantage Quantification -> ICAT or other methods are being developed. Limitations in chromatographic separation -> 2D LC Difficult for small amount of proteins in large mixtures No additional direct information on proteins (i.e. MW, Ip)
.")
48
Two problems in LC- MS/MS based proteomics 1.Automatic program. 2.Sample complexity John Yates (Scripps) SEQUEST : Computer algorithm for MS/MS database search. MUDPIT (Multi Dimensional Protein Identification Technology)
 SEQUEST : Computer algorithm for MS/MS database search. MUDPIT (Multi Dimensional Protein Identification Technology).")
49
Yates, R,III et.al, Nat. Biotechnology, 2001, 19, 242 MUDPIT (Multidimensional protein identification technology) analysis of S. Cerevisiae ->1484proteins identified, 131 membrane proteins
 analysis of S. Cerevisiae ->1484proteins identified, 131 membrane proteins.")
50
Protein digest mixtures SCX fractionation CID MS-1 MS-2 Micro electrospray ionization Auto MS/MS detection Tandem Mass Spectra Database search protein I.D. RP fractionation Advantages Dynamic Range 10 5 Sensitivity! Low abundance proteins Minimized protein bias Highly automated Carrier effect Disadvantages Poor isoform & modification distinction Still overwhelms the mass spectrometer. Does not give you a very good “snapshot”

51
2D-GE vs. LC-MS/MS based proteomics

52
2DGE vs LC-MS/MS: 17 protein mixtures Myosin BSA Transferrin Glutamic dehydrogenase GAPDH Alcohol dehydrogenase Carbonic anhydrogenase Feritin Myosin Actin

53
SEQUEST search of 1D LC-MS/MS

54
Another example: 1D SDS-PAGE Band from a human sample that clearly showed a single gel band at ~40kDa. => Cut out, in-gel digested, and MS finger printing was performed All you find is actin! at the same MW. Ran 1D LC-MS/MS (next page): Over 30 proteins identified. 20 proteins except keratin contamination.
: Over 30 proteins identified. 20 proteins except keratin contamination..")
56
Targeted Proteomics

57
Challenges in serum proteomics mg/ml g/ml ng/ml

58
88 10 1 Out of ten balls chosen, there are 7, 2, 1. Do you have 70%, 20%, 10% ? What’s the problem? : all about statistics. We are characterizing ~1000 MS/MS spectra out of >100,000 peptides. Two take-home messages: Proteomics technology only tells you about presence of proteins, not absence. Quantitative information needs sufficient sampling.

59
-Global Proteomics: Arabidopsis Science, 2008, 320, 938-941 48%

60
Hypothesis driven Targeted Proteomics Problem in Global proteomics Identifying all the proteins in complex mixture is impossible (Dynamic range). Many separation methods were developed : GELCMS, Mudpit, protein 2D LC, Zoom IEF etc. Even after many steps of separation, still can’t detect low abundance protein. Procedure In-silico digestion of target protein Monitor specific target peptides using LC-SRM Quantify with AQUA peptides.

61
Single Reaction Monitoring Monitoring specific fragment i.e. SPTGER from ETSPTGER 100% transmission efficiency for the given reaction.

62
Computer program generates best peptide candidates to monitor target proteins. MRM with triple quadrupole mode MS/MS spectra in linear ion trap mode

63
Validation and clinical assay development Immunoassay. (Low Multiplexing) 1000s samples. (High-throughput) Discovery Candidate Biomarkers (Global Analysis) Extensive fractionation & LC-MS/MS (Low Throughput) Exhaustive Analysis of 10s of samples Verification of candidate biomarkers (Targeted analysis) Modest fractionation & LC-SRM analysis. (High-multiplexing) 100s of samples. (Medium Throughput)
 1000s samples. (High-throughput) Discovery Candidate Biomarkers (Global Analysis) Extensive fractionation & LC-MS/MS (Low Throughput) Exhaustive Analysis of 10s of samples Verification of candidate biomarkers (Targeted analysis) Modest fractionation & LC-SRM analysis. (High-multiplexing) 100s of samples. (Medium Throughput).")
64
Human HDAC4/5 phosphorylation Found 17 phosphorylation sites from in vitro expt. Monitoring those sites in vivo using MRM traces. Quantification with AQUA peptide for phosphorylation yields Phosphorylation yield = 12fmol/60 fmol = 20% 01020304050 10.22 01020 304050 Time (min) 10.22 TA SEPNLK TA SEPNL*K 4.66e4cts 1.11e4cts 01020304050 Time (min) 10.81 01020304050 TA pSEPNLK 5.18e2cts TA pSEPNL*K 8.42e3cts 10.81 200fmol 48fmol 12fmol
 TA SEPNLK TA SEPNL*K 4.66e4cts 1.11e4cts Time (min) TA pSEPNLK 5.18e2cts TA pSEPNL*K 8.42e3cts fmol 48fmol 12fmol.")
65
Flowering Gene Protein (FT) in Pumpkin Phloem Collaboration with Dr. Lucas, Plant Science Plant Cell, 2007, 19, 1488-1506.

66
20406080100120140160 61.81 VIGDVIDSFTR*: 200fmol VIGDVIDSFTR: ~13fmol TIC of pumpkin phloem proteins 7.08e3 4.82e2 y series ions: -10Da shift b series ions: 0Da shift VI GDVIDSFTR VI GDVIDSFTR*

67
Phloem Sap in Short DaysPhloem Sap in Long Days C D 32.0 VE IGGTDLR* 100 80 60 40 20 VE IGGTDLR ~11 fmol A VI GDVIDSFTR* VI GDVIDSFTR ~40 fmol B 62.7 300 200 100 500 400 300 200 100 VE IGGTDLR* VE IGGTDLR ~0 fmol VI GDVIDSFTR* 31.6 63.5 VI GDVIDSFTR ~0 fmol 800 600 400 200 10 6 10 4 100 80 60 40 20 100 80 60 40 20 Internal Standard (Control) Native peptide
 Native peptide")
68
VE IGGTDLR ~0 fmol 10 3 100 50 VI GDVIDSFTR ~0 fmol 28.758.8 57.8 VI GDVLDSFTK 10 3 Heterogenosly grafted Moshata on Maxima. Moshata FT protein Maxima FT protein Maxima FT could flower grafted Moshata through phloem: Evidence of flowering signal is not FT mRNA but FT protein.

69
Other Proteomics Approach and Applications

70
Zubarev, Kelleher, McLafferty,JACS1998,120, 3265-3266.

73
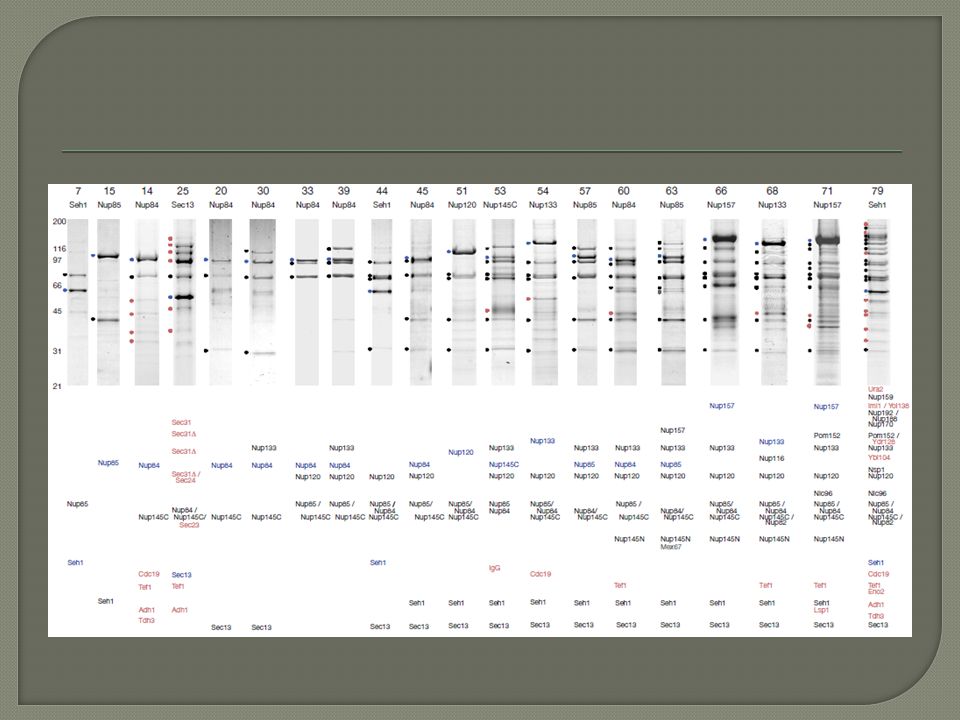
Systematic identification of protein complexes in Saccharomyces cerevisiae by mass spectrometry – Nature 415, 180-183, 2002

74
D. Figeys et. Al, Nature, 2002, 415, 180 High-throughput mapping of protein complexes by MS recombinant based cloning of 725 yeast genes w/ a FLAG epitope tag Total of 1578 different interactions.

75
NATURE METHODS 2007, 4, 822

76
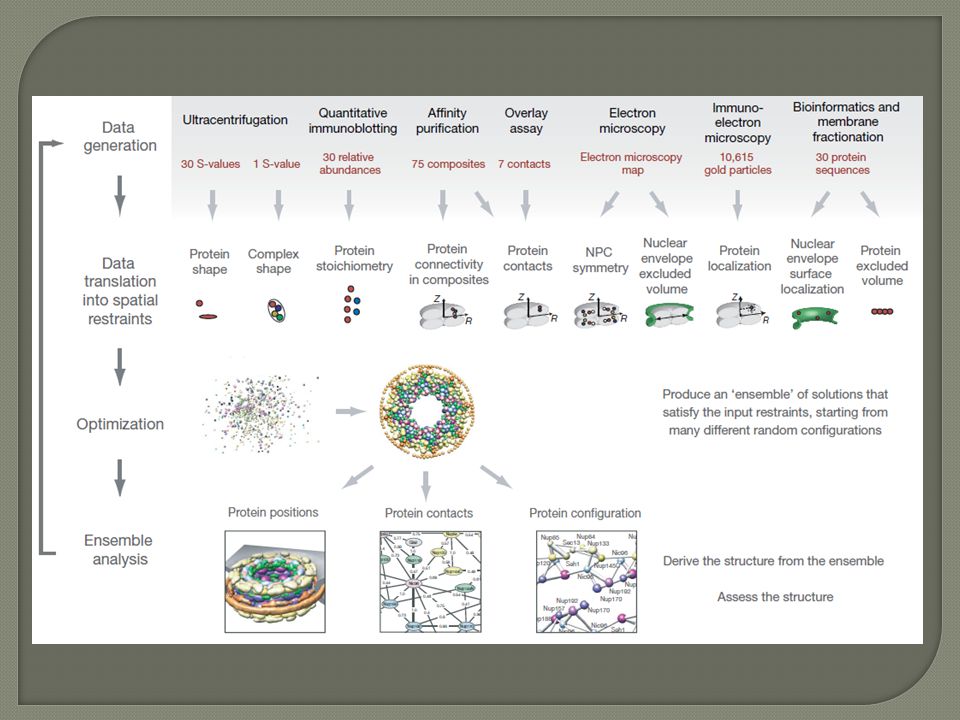
Nature, 2007, 450, 683

Similar presentations


 proteome: complete.>")


 1’ C 5’ PO4 (free) DNA is a linear polymer of nucleotide subunits joined together by phosphodiester bonds - covalent bonds between.>")


 Course Director David Fenyö Contact information>")
 PNAS 100(12), 6940-6945. presented by Jessica.>")

