Download presentation
Presentation is loading. Please wait.

2
Shifting Demographics: Mapping the World Population
United Nations Hania Zlotnik Directora

3
World population growth: 1750-2050
Billions 10.8 billion 9.2 billion 6.5 billion 7.8 billion 5.5 billion 12 2.5 billion 2 billion 1 billion 120 years United Nations Population Division

4
United Nations Population Division
Growth rate, Percentage 2.0 1.24 0.34 United Nations Population Division

5
Increasing life expectancy: 1950-2050
Years 83 Northern America 78 75 World Europe Latin America 66 Africa 66 Oceanía Asia 52 United Nations Population Division

6
Life expectancy at birth : 2005
United Nations Population Division

7
United Nations Population Division
Fertility levels: Children per woman Africa Asia World 4.9 Oceanía Latin America 2.65 2.5 Europe Northern America 1.76 1.41 United Nations Population Division

8
United Nations Population Division
Children per woman: 2005 United Nations Population Division

9
As a result of these changes:
There is today great diversity in demographic trends around the world The population of some countries is decreasing…. While that of other countries is growing very fast….

10
Population growth rate: 2000-2005
United Nations Population Division

11
Population growth rate: 2045-2050
United Nations Population Division

12
Population by major area
Billions 5.3 3.9 2.0 0.8 0.9 0.7 0.6 0.5

13
Population percentage by major area

14
The world is being transformed by increasing urbanization
Between 1950 and 2005: The urban population increased by 2.4 billion persons, equivalent to the population of the world in 1950 Between 2005 and 2050: The urban population is expected to increase by 3.2 billion, virtually all added to urban areas in developing countries

15
Percentage urban in 2005

16
Percentage urban in 2030

17
The world is also being transformed by population ageing
United Nations – Population Division

18
As the distribution by age changes, the ratio of “workers” y to “dependants” also changes
Dependants: Children (0-14) y older persons (aged 65 or over) Workers: Persons aged 15 to 64 Support ratio: Workers / Dependants
 y older persons (aged 65 or over) Workers: Persons aged 15 to 64. Support ratio: Workers / Dependants.")
19
Demographic transition
Drop in fertility levels Stability Mortality drops and fertility stabilizes Reduction in infant mortality The demographic transition refers to the process of change in the age structure of a population. This process is generally driven by two separate events: first, a a reduction in mortality and later a reduction in fertility. There are four distinct stages: During the first stage, the main change is a drop in infant mortality this leads to a higher growth rate and a rejuvenation of the population. mortality rates among older persons also tend to improve, but this change happens more slowly and is less significant as it affects a smaller number of people, especially in countries with high mortality. Followed by drops in the fertility rates during the second stage the second stage of the transition is marked by a reduction in fertility that may also be accompanied by a postponement of the first child. This process not only slows down population growth but also starts the process of population ageing as the ‘median’ age begins to rise. During the third stage, mortality continues to improve across all ages and fertility rates level out The large cohort of working-age population, caused by the first stage, begins to retire. The fourth and final stage is when the changes stabilize and the population distribution becomes constant United Nations – Population Division

20
Source: United Nations Population Division
Support ratio: Europe Asia World Northern America Latin America Oceania Africa Source: United Nations Population Division

21
Median age, 2005

22
Median age in 2050

23
Increase of number of migrants by income group
Millions The link between economic development and international migration is even clearer when we look at changes over time is presented in yellow, 2005 in orange. From 1990 to 2005, the number of international migrants in high-income developed countries increased by 34 million. As the graph shows, this group recorded the highest increase from 1990 to 2005. In the high-income developing countries, the number of international migrants increased by 7 million or 50 per cent from 1990 to 2005. In all other groups, the number of international migrants increased very little or decreased. Conclusion: almost the entire increase in the global number of international migrants since 1990 was recorded in the high-income developed countries.

24
Population of working age in developed countries with and without migration
104 million Without migration I just mentioned the impact of population ageing on the future labour force. This chart shows the importance of international migration for the labour force in developed countries. The green line represents the trend in the projected labour force in developed countries from 2000 to As you see, with current levels of international migration, the labour force is expected to decline significantly. However, according to our projections, the labour force in developed countries will decline even more rapidly without migration. This scenario is shown by the pink line. Without migration the labour force will fall with almost 100 million or 13 per cent in 2050 as compared the scenario with international migration. In short, international migration is very important for the future labour force in developed countries.

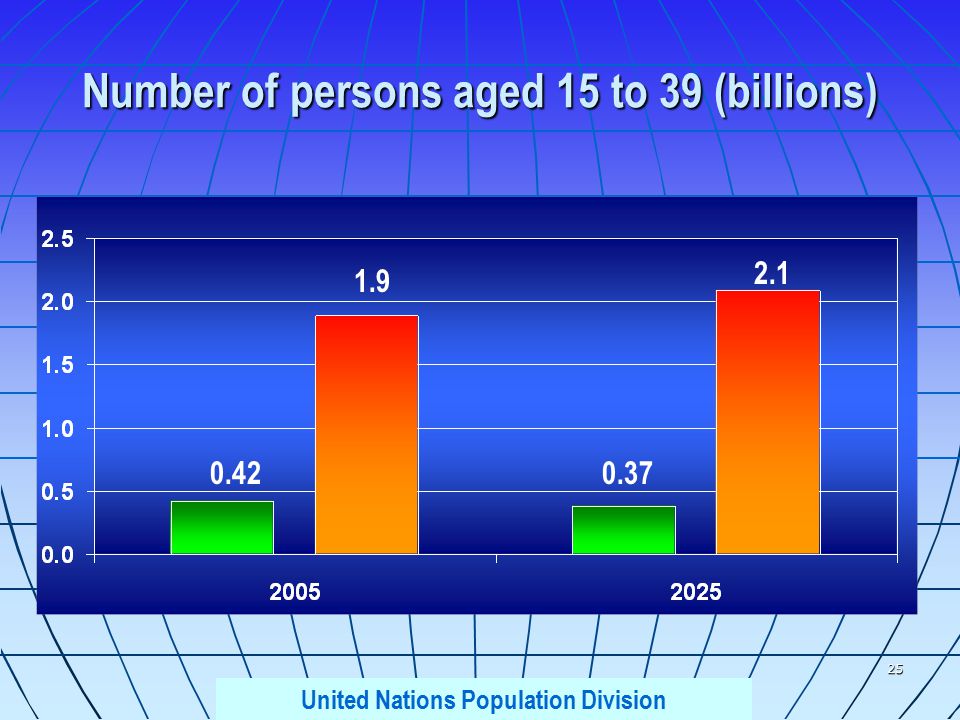
25
Number of persons aged 15 to 39 (billions)
2.1 1.9 0.42 0.37
26
Annual number of migrants needed to maintain population aged 15 to 64 constant
Net number of migrants (thousands)
")
27
Conclusions The population will increase markedly in Africa and Asia. It will likely decrease in Europe. Africa and Asia will urbanize rapidly in the future Population ageing is advanced in Europe and Northern America. Support ratios will drop significantly in Europe. Population ageing will advance quickly in Asia and Latin America, with support ratios beginning to drop Africa will remain relatively young.

28
Conclusions Over the next decades, the younger population of developed countries will decrease while that in developing countries will continue to grow The economic and demographic imbalances between developed and developing countries will continue to fuel migration

29
Population Division United Nations
For information relating to the High-level Dialogue Conclusion The High-level Dialogue on international migration and development was a success. Many countries supported the creation of the Forum to continue the dialogue. The Forum is very much a State led initiative, with only a thin link to the United Nations. The future of the Global Forum on Migration and Development is rather uncertain. The Philippines have informally announced that they are willing to organize the second meeting of the Forum next, but that is still to be confirmed. United Nations Population Division

Similar presentations


 Mr Elliott SSOT.>")


