Download presentation
Presentation is loading. Please wait.

1
Experimental and Numerical Study of the Effect of Geometric Parameters on Liquid Single-Phase Pressure Drop in Micro- Scale Pin-Fin Arrays Valerie Pezzullo, Florida State University Steven Voinier, The College of New Jersey Jonathan Mita and Dr. Weilin Qu High Performance Computing Applications Research Experiences for Undergraduates Program: Computational Fluid Dynamics (HARP) University of Hawai’i at Manoa Dept. of Mechanical Engineering Honolulu, HI, USA
 University of Hawai’i at Manoa Dept. of Mechanical Engineering Honolulu, HI, USA.")
2
Overview ● Objectives ● Background ● Experimental Methods ● Experimental Results ● Numerical Methods ● Numerical Results ● Conclusions ● Acknowledgements & References

3
Objectives ● Experimentally determine water single-phase pressure drop across a staggered circular micro pin- fin array ● Use OpenFOAM to calculate pressure drop and friction factor for a range of Reynolds numbers and various pin geometries ● Compare numerical results with experimental data to validate computational models

4
Background ● Micro-scale pin-fin heat sinks are in the process of being implemented in electronics as cooling devices ● Current air-cooled heat sinks are becoming less effective as more transistors are put on a single chip, increasing the heat flux ● Liquid-cooled micro-scale heat sinks are being studied for compared efficiency and effectiveness

5
Background ● Experimental study can be time consuming and expensive when different geometries are desired ● Numerical analysis and simulations are performed to estimate pressure drop when it is not feasible to manufacture and experiment on many different heat sink geometries

6
Experimental Methods

7
Flow Loop

8
Test Module

9
Heat Sink Geometry Original Geometry: ● 180 x 683 µm ● 1840 staggered pin-fins ● 1 x 3.38 cm projected area ● 81 rows in flow direction

10
Experimental Results Temperature ( ° C )
")
11
Previous Experimental Results

12
Experimental Results Temperature ( ° C )
")
13
Previous Experimental Results

14
Numerical Methods

15
Geometry and Computational Domain ● Using a simplified geometry of 20 staggered-pin rows in flow direction

16
Assumptions ● Steady flow ● Incompressible fluid ● Laminar flow ● Adiabatic flow ● Constant Fluid Properties ● Used upwind differencing scheme with simpleFoam – Steady State – Incompressible – Turbulent flow (turned off) ● No-slip wall conditions at top, bottom, and pin surfaces
 ● No-slip wall conditions at top, bottom, and pin surfaces")
17
Solution Method ● Continuity Equation: ∇∘ U = 0 ● Momentum Equation: ρ f (U ∘∇ U) = - ∇ P + ∇∘ (μ f ∇ U) ● Three-dimensional finite volume simulation Convective Acceleration Pressure Gradient Viscosity Incompressible fluid
 = - ∇ P + ∇∘ (μ f ∇ U) ● Three-dimensional finite volume simulation Convective Acceleration Pressure Gradient Viscosity Incompressible fluid")
18
Boundary Conditions ● No-slip wall ● Inlet – Flow field is uniform and only has velocity in flow direction ● Outlet – Ambient Pressure ● Symmetry

19
Mesh ● Mesh for original geometry

20
Changes in Geometry ● Alter existing mesh ● Scale all parameters, keep ratio constant º Multipliers: 0.5; 1.5; 2 ● Scale ST, all other parameters constant º Multipliers: 1; 1.5; 2; 2.5; 3

21
Equations Used in Post-Processing

23
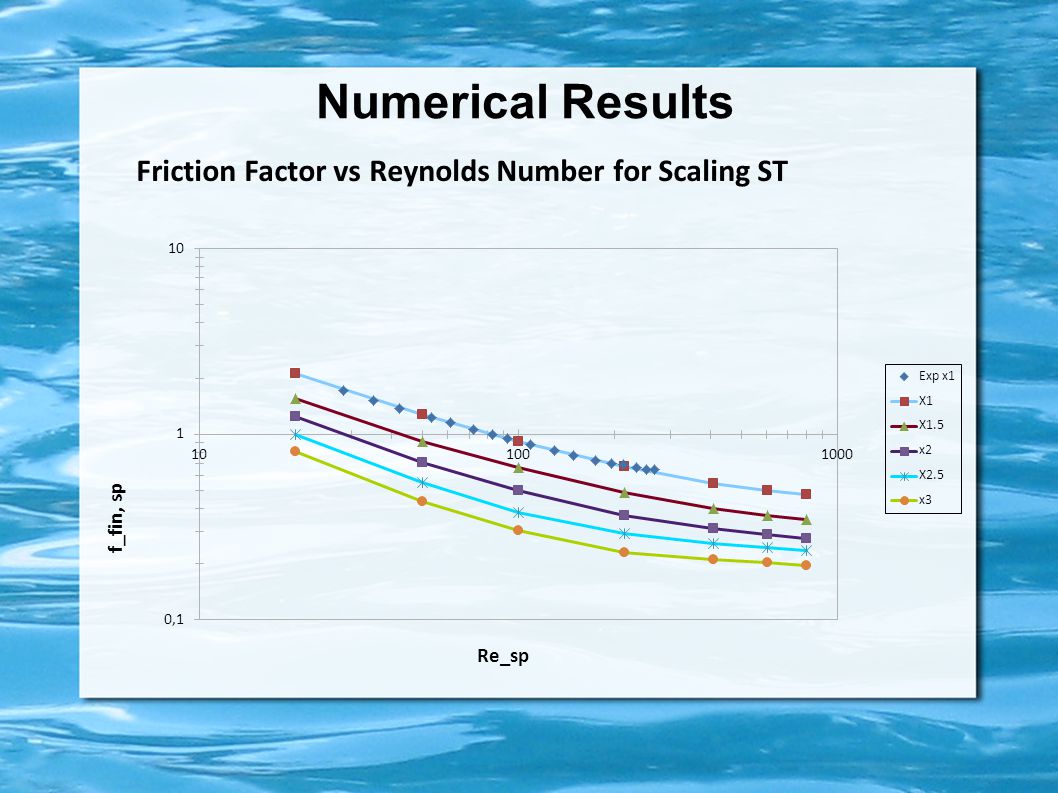
Numerical Results

25
Conclusions ● Scaling all parameters does not significantly affect the pressure drop and friction factor vs. Reynolds number correlation ● Scaling ST does affect the pressure drop and friction factor vs Reynolds number correlation – As scaling multiplier increases, f vs Re curves are shifted some factor below the previous curve – Curves begin to converge as Re increases

26
Recommendations for Future Work ● Revise mesh to yield more accurate results ● Repeat numerical study, changing SL and height H ● Compare changes in ST, SL, and H independently to study effect on friction factor ● Formulate f vs Re correlation equation based on power regression from numerical analysis ● Heat Transfer applications using our generated mesh

27
Mesh Revision ● New Mesh: ● Old Mesh:

28
Heat Transfer Mesh ● Top: cover plate ● Bottom: baseplate ● Mesh is reverse of fluid flow mesh

29
Acknowledgements ● We would like to thank the following people and organizations for their guidance and support: – Jonathan Mita – Dr. Weilin Qu – Dr. Susan Brown – University of Hawaii at Manoa – UH Manoa College of Engineering – National Science Foundation – OpenFOAM ● This material is based upon work supported by the National Science Foundation under Grant No. 0852082. Any opinions, findings, and conclusions or recommendations expressed in this material are those of the author(s) and do not necessarily reflect the views of the National Science Foundation.
 and do not necessarily reflect the views of the National Science Foundation..")
30
References J. Mita, W. Qu, M. Kobayashi “Experimental and Numerical Analysis of Water Single-Phase Pressure Drop Across an Array of Circular Micro- Pin-Fins.” University of Hawaii at Manoa Dept of Mechanical Engineering. PowerPoint. 2011. J. Mita "Experimental and Numerical Study of Water Single-Phase Pressure Drop Across An Array of Circular Micro-Pin-Fins.” MS thesis. University of Hawaii at Manoa, 2011. Print.

Similar presentations


>")


>")


>")