Download presentation
Presentation is loading. Please wait.

1
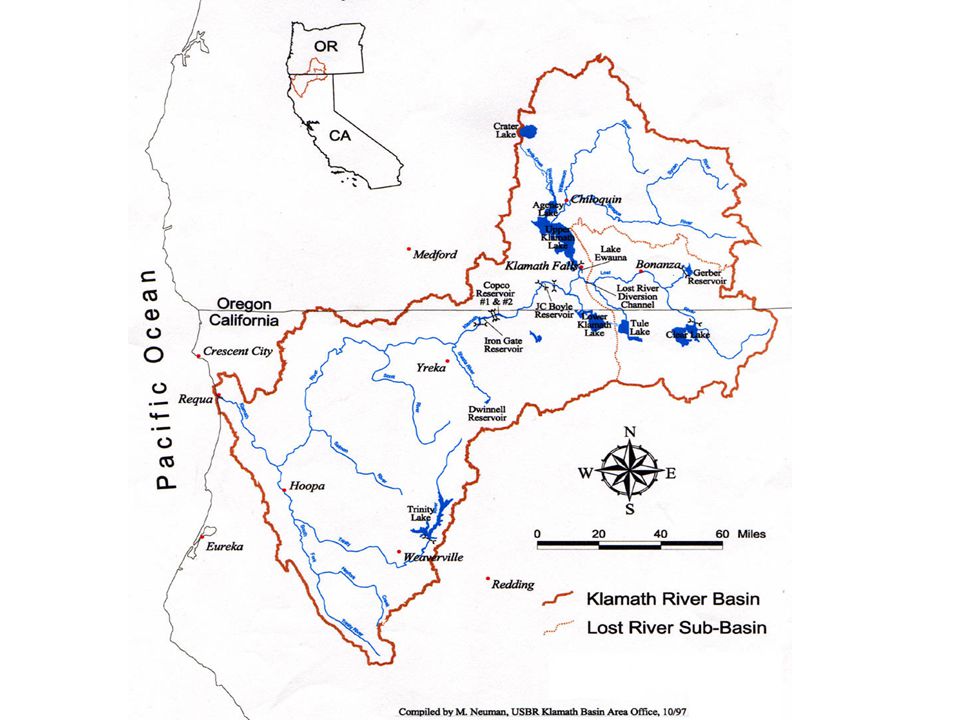
Klamath Watershed in Perspective A Review of Historical Hydrology of Major Features of the Klamath River Watershed and Evaluation of Hardy Iron Gate Flow Requirements K.A. Rykbost R. Todd Superintendent Klamath County Extension Service Klamath Experiment Station Oregon State University Oregon State University K.A. Rykbost R. Todd Superintendent Klamath County Extension Service Klamath Experiment Station Oregon State University Oregon State University

2
Objectives of the Study Gain a better understanding of the total Klamath watershed and its hydrologic history Develop multi-year hydrographs at key locations in the watershed to look for long-term trends in flows of major tributaries and the Upper Basin Examine Klamath Project long-term operations to determine the probability of achieving flow requirements recommended in Hardy Reports

3
Data Sources and Limitations Streamflow data are from Bureau of Reclamation and U.S. Geological Survey records available on the Internet Years of record vary for various subbasins in the watershed Minimum Instream Flows from Hardy studies are taken directly from Hardy Phase I Final Report and Hardy Phase II Draft Report

4
Data Sources and Limitations Klamath Project water diversions reported include agricultural and refuge use as calculated by Jim Bryant at the Bureau of Reclamation Data are summarized over years to mask the inherent and large variability between water year types due to precipitation fluctuations

5
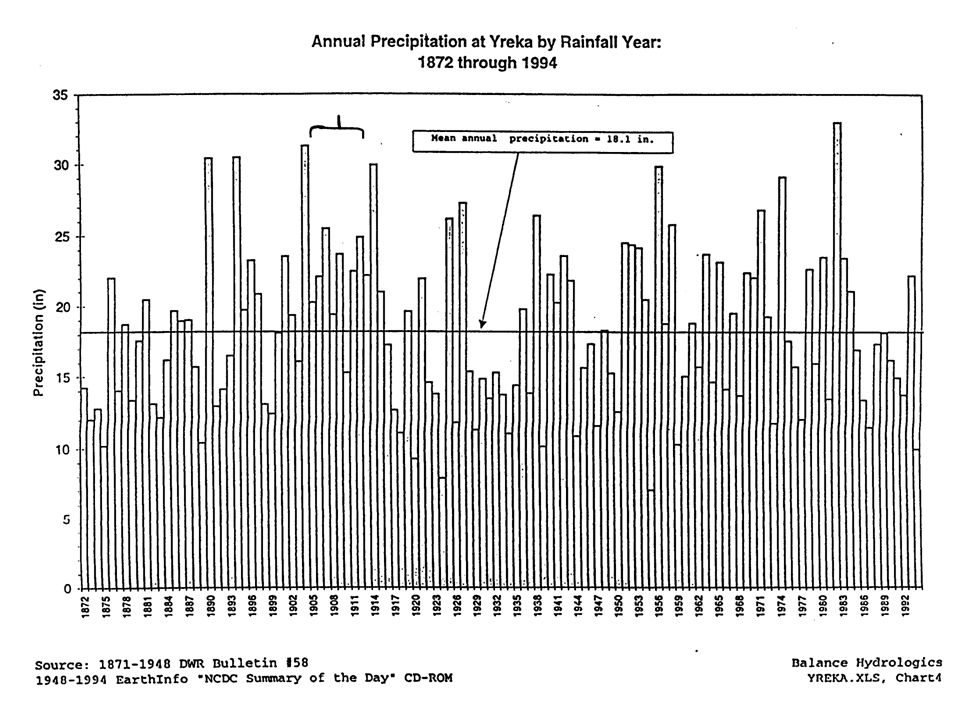
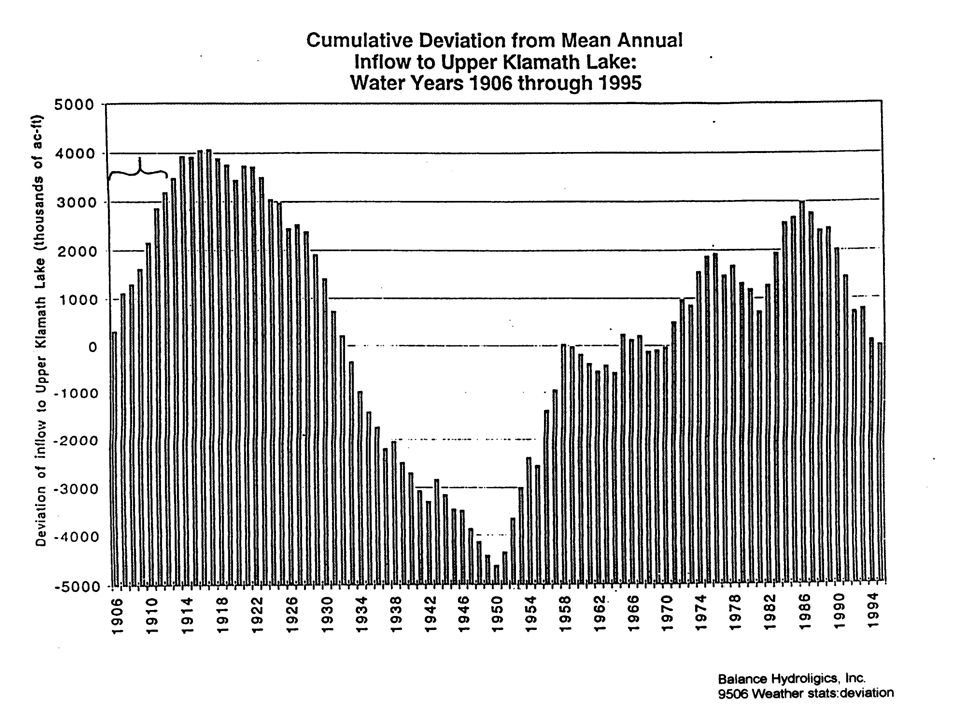
Major studies and reports shaping public policy have used a non-typical hydrologic period as the basis for historical flows Reports by Balance Hydrologics, Inc. and Hardy Phase I use flows at Keno, OR from 1905-1912 as a partial basis for estimating pre-Klamath Project Upper Basin flows Selective Use of Data

6
Balance Hydrologics, Inc. used a 4% correction to account for 1905-1912 being an above average precipitation period Compared with long term records, 1905-1912 experienced 21% above normal precipitation in Yreka, CA and 4% above normal in Klamath Falls The Bureau of Reclamation estimated inflow to UKL at 34% above normal in 1905-1912 Selective Use of Data

9
The Lost River Slough was dammed in 1890 to stop drainage of excess flows from Klamath River to Tulelake Construction of a railroad through Lower Klamath Lake between 1907-1911 reduced overflows from Klamath River to Lower Klamath Lake, reducing large evaporation losses Both changes resulted in increased flows at Keno compared with pre-settlement hydrology Changes in Upper Basin Hydrology

10
Pre-development, the Lost River system was a closed basin with no access to Klamath River Project features now allow diversion from the Gerber, Clear Lake, Lost River system to Klamath River through the Diversion Channel Direct access to Klamath River is available from Tulelake through Lower Klamath Refuge and the Straits Drain Changes in Upper Basin Hydrology

11
Annual Precipitation in the Klamath Basin Long-term NOAA precipitation records are available for Klamath Falls, Crater Lake, and Keno, OR, and Yreka and Klamath, CA Total Annual precipitation is charted for each location for 1951-2000 Average precipitation for multi-year periods that will be used for streamflow data presentation are quite similar at each location

12
K. Rykbost and R. ToddOSU 2003

13
Streamflows for Klamath River Tributaries Iron Gate Dam records begin in 1960 Data for the Klamath Mouth is not available for 1994-1997 The major tributaries contribute about 54% of flow at the mouth for the period of record Remaining flows are from smaller tributaries and include 360 TAF (thousand acre-feet) of accretions from Keno to Iron Gate Dam
 of accretions from Keno to Iron Gate Dam")
15
K. Rykbost and R. ToddOSU 2003

16
K. Rykbost and R. ToddOSU 2003

17
Klamath Mouth Annual Hydrograph Limited Klamath Project diversions in 1911-1925 Klamath Project fully developed by 1960 Trinity River Diversion started about 1964 Consistent low flows in August and September Wide range of flows in December through March

18
K. Rykbost and R. ToddOSU 2003

19
Trinity River Annual Hydrograph Shape of hydrograph is very similar to Klamath mouth hydrograph Significant change in April through June for periods before and after Trinity Diversion Diversion was about 1.1 MAF (million acre-feet) in 1964-1986 and 0.73 MAF from 1987-2000 (CDWR)
 in and 0.73 MAF from (CDWR)")
20
K. Rykbost and R. ToddOSU 2003

21
Trinity Hydrograph Pre- and Post- Diversion Important to note that diversion only diverts flows from the upper 20% of the total Trinity system measured at Hoopa, CA Hydrograph suggests diversion occurs between March and July February dip in post-diversion hydrograph is related to filling of Trinity reservoirs August through December graphs are identical

22
K. Rykbost and R. ToddOSU 2003

23
Klamath Mouth Hydrograph pre- and post- Trinity River Dams Main difference coincides with reduced post-dam spring Trinity River hydrograph August and September flows nearly identical pre- and post-Trinity dam Period of apparent shortage coincides with request for increased flows for smolt out- migration

24
K. Rykbost and R. ToddOSU 2003

25
Salmon River Hydrographs No out of stream diversions from Salmon River, but seasonal hydrograph coincides with Trinity’s Hydrographs show similar trends for varied flows from December through April, but consistent low flows in August and September Pre- and post- Trinity Diversion periods have nearly identical hydrographs from June through October

26
K. Rykbost and R. ToddOSU 2003

27
K. Rykbost and R. ToddOSU 2003

28
Scott River Hydrographs Same seasonal hydrograph trends as observed for Trinity and Salmon Rivers Diversions for agriculture are estimated at 70 TAF or about 15 % of Scott River watershed yield (CDWR) Study by Drake, Tate, and Carlson reported precipitation accounted for 75-80 % of fall flow variability
 Study by Drake, Tate, and Carlson reported precipitation accounted for % of fall flow variability")
29
K. Rykbost and R. ToddOSU 2003

30
Shasta River Hydrographs More uniform hydrographs across years than other tributaries CDWR estimates agricultural diversion is about 100 TAF annually Diversion represents about 40 % of Shasta yield and 25 % of Klamath Project diversion from UKL and Klamath River

31
K. Rykbost and R. ToddOSU 2003

32
Iron Gate Dam Hydrographs Annual discharge declined from 1.75 MAF in 1964-76 to 1.38 MAF in 1990-2000 No significant increase in Klamath Project agriculture diversions from 1960s to present Mean flows from May through August were similar in all periods

34
K. Rykbost and R. ToddOSU 2003

35
Meeting Hardy Minimum Instream Flows at Iron Gate Dam Hardy Phase I recommended an “average” year flow regime requiring annual discharge at Iron Gate Dam of 1.62 MAF Average 1961-1997 Iron Gate flow is 1.53 MAF Total annual flows at Iron Gate were less than Hardy Phase I “average year” flows in 25 of the 42 years from 1961-2002

36
Meeting Hardy Minimum Instream Flows at Iron Gate Dam Revised Hardy Phase II flow regimes set 5 hydrologic year-types based on projected April- September inflow to UKL: Critical: Inflow < 286.8 TAF Dry: Inflow 286.8 – 458.3 TAF Average: Inflow 458.4 – 568.5 TAF Above Avg: Inflow 568.6 – 785.2 TAF Wet: Inflow >785.2 TAF

37
K. Rykbost and R. ToddOSU 2003

38
Can Hardy Phase II Targets for Iron Gate Dam be Met? No consideration for minimum lake elevations, overflows in spill mode, or timing of flows to meet summer targets in the analysis Evaluation only considers total annual Iron Gate flows and whether individual years achieved those flows based on year type targets Results are charted by year type for 1961-2002 Charts show surplus or deficit (-) by year type
 by year type.")
39
K. Rykbost and R. ToddOSU 2003

40
K. Rykbost and R. ToddOSU 2003

41
K. Rykbost and R. ToddOSU 2003

42
K. Rykbost and R. ToddOSU 2003

43
K. Rykbost and R. ToddOSU 2003

44
K. Rykbost and R. ToddOSU 2003

45
Hydrographs for Klamath River below Keno No data are available for 1913-1930 Historical flow models in Balance Hydrologic Inc., Trihey, and Hardy Phase I Reports are partially based on 1905-1912 Keno flows Trends are same as Iron Gate for 1964-2000 Annual accretions between Keno and Iron Gate Dam are about 360 TAF or about 500 cfs

46
K. Rykbost and R. ToddOSU 2003

47
Williamson River Flows at Modoc Point Road Williamson River accounts for about 46 % of inflow to UKL according to several studies Williamson River watershed yield per inch of precipitation at Klamath Falls or Crater Lake has declined significantly over the past 50 years Changes in the upper Williamson, Sycan, and Sprague Rivers seem apparent

48
K. Rykbost and R. ToddOSU 2003

49
K. Rykbost and R. ToddOSU 2003

50
Klamath Watershed in Perspective Summary The Upper Basin above Iron Gate Dam, including Klamath Project diversions, accounts for about 15 % of annual flow at the mouth of Klamath River over past 40 years Klamath Project agricultural water use has not changed significantly in the past half century High summer flows requested for environmental use are only potentially available because of storage designated for agricultural irrigation

51
Klamath Watershed in Perspective Summary All tributaries in the Klamath system produce hydrographs with widely varying winter and spring flows but consistently low summer flows Trinity diversions represent about 20 % of river yield and appear to mainly affect the spring hydrograph for Trinity and mouth of Klamath Watershed yield above UKL appears to have declined in recent decades

52
Klamath Watershed in Perspective Summary Hardy flow regimes requested for summer months could not be met in a significant number of years even if the Klamath Project received no diversions from UKL or Klamath River Basing historical flows on 1905-1912 Keno flows results in unachievable expectations

53
Klamath Watershed in Perspective Summary The 1905-1912 period used to model flows is the only period since 1905 when streamflow records are unavailable in all other reaches of the watershed This fact precludes the ability to compare the yield at Keno, OR with flows in the Lower Klamath River Basin or other tributaries

Similar presentations


>")


 Description of Yakima River Basin and Yakima Storage Project MMS and Yakima River Basin models Global Climate-Change.>")


