Download presentation
Presentation is loading. Please wait.

1
Scanner Characteristics

2
MODIS Orbit and Scan Geometry
Terra: 10:30 am local descending Aqua: 1:30 pm local ascending Orbit period: 99 minutes Repeat cycle: 16 days (same as Landsat) Scan mirror: Double sided, 20.3 revs/minute Scan rate: scans/sec Scan angle: +/- 55 degrees Swath width: 2330 km across track, 10 km along track
 Scan mirror: Double sided, 20.3 revs/minute. Scan rate: scans/sec. Scan angle: +/- 55 degrees. Swath width: 2330 km across track, 10 km along track.")
3
Image Acquisition Details
Scan direction Image Acquisition Details Scan sequence: Solar diffuser Spectroradiometric Calibration Assembly Blackbody Space View Earth scan Flight direction

4
MODIS Bowtie Artifacts
Consecutive “bowtie” shaped scans are contiguous at nadir, and overlap as scan angle increases…

5
MODIS bowtie artifacts at edge of swath
Band 2 (0.87 micron) 250 meter resolution
 250 meter resolution.")
6
Bowtie Artifacts Are not a ‘problem’: they are a consequence of the sensor design Can be removed for visualization purposes by reprojecting the image onto a map Do not affect science algorithms that run on a pixel-by-pixel basis or within one earth scan Will be present on next generation of operational polar orbiting imagers (VIIRS on NPP/NPOESS)
")
7
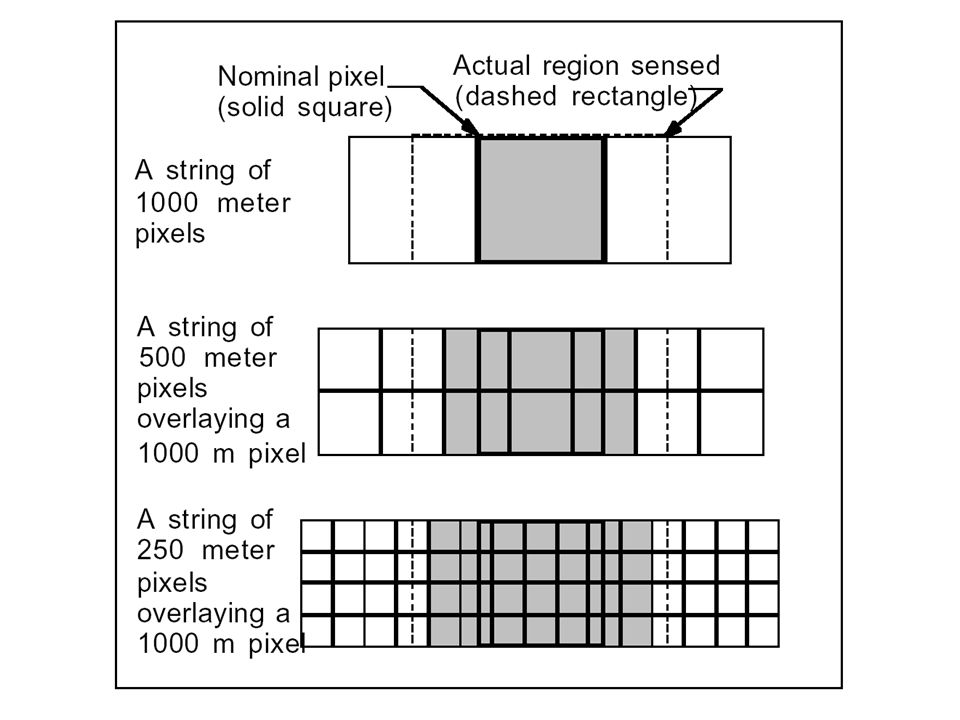
Inter-band Registration

9
Nominal MODIS inter-band registration
First 1000 m pixel Second 1000 m pixel Geolocation is computed here

10
MODIS Geolocation Earth locations computed for every 1000 meter pixel (WGS84): Geodetic latitude (degrees, -90S to +90N) Geodetic longitude (degrees, -180W to +180E) Sensor zenith and azimuth (degrees, pixel to sensor) Solar zenith and azimuth (degrees, pixel to sun) Terrain height above geoid (meters) Land/Sea mask 0: Shallow Ocean 1: Land 2: Ocean Coastlines and Lake Shorelines 3: Shallow Inland Water 4: Ephemeral (intermittent) Water 5: Deep Inland Water 6: Moderate or Continental Ocean 7: Deep Ocean
![]()
11
Land-sea mask South America inland water
From EOS DEM SWG – best available sources

12
MODIS geolocation includes terrain correction based on 1000 meter DEM
Line of sight to sensor Earth location with terrain correction Earth location without terrain correction

13
Growth of MODIS 1 km pixel with scan angle
![]()
14
Terra Geolocation Measured RMS Error
Update 2 – June ‘00 (Collection 1) Update 3 – Feb. ‘01 (Collection 3) Along Scan 58 m 56 m Along Track 57 m 74 m # Days 196 214 Match-ups/day 77 82 The images are of MODIS data (blue) and Simulated MODIS data (red) derived from TM Data using the MODIS geometric model. The top image shows the misalignment before bias removal. There is a strong red line off the coast showing the misalignment. The bottom image shows the images after the bias is removed. Three Geolocation LUT updates since launch Nadir equivalent meters Update 3 vs. 2: Scan direction error better Track direction error worse
 Update 3 – Feb. ‘01. (Collection 3) Along Scan. 58 m. 56 m. Along Track. 57 m. 74 m. # Days Match-ups/day The images are of MODIS data (blue) and Simulated MODIS data (red) derived from TM Data using the MODIS geometric model. The top image shows the misalignment before bias removal. There is a strong red line off the coast showing the misalignment. The bottom image shows the images after the bias is removed. Three Geolocation LUT updates since launch. Nadir equivalent meters. Update 3 vs. 2: Scan direction error better. Track direction error worse.")
15
Realtime Geolocation For realtime processing, ephemeris and attitude downlinked from spacecraft must be used. Post-processed ephemeris and attitude from NASA GSFC Flight Dynamics may be used for non realtime processing (delay of at least 24 hours after data acquisition) What is the impact on geolocation accuracy of realtime processing?
 What is the impact on geolocation accuracy of realtime processing")
16
Figure courtesy of Stefan Maier, DOLA

17
Image Artifacts (other than Bowtie)
")
18
Mirror Side Striping (Band 8, 0.41 m)
Reflectance, emissivity, or polarization of each scan mirror side not characterized correctly. Can be corrected.

19
Detector Difference Striping (Band 27, 6.7 m)
Responsivity of each detector not characterized correctly. Can be corrected.

20
Noisy Detectors (Band 34, 13.6 m)
Detectors are noisy on a per frame basis and unpredictable from scan to scan. Difficult to correct.

21
Saturation (Band 2, 0.87 m) Signal from earth scene is too large for 12 bit digitization with current gain settings. Work around available.

22
Handling Saturation in Bands 1-5
Problem: Bright cloud tops cause bands 1-5 to saturate, and the MODIS Cloud Mask cannot process these pixels correctly. It also makes true color image creation problematic (bands 1, 4, 3). Approach: Replace saturated pixels with maximum scaled integer. Method: Check for scaled integer values corresponding to “Detector is saturated” (65533) or “Aggregation algorithm failure” (65528). Replace these values with maximum allowed scaled integer (from valid_range attribute).
. Approach: Replace saturated pixels with maximum scaled integer. Method: Check for scaled integer values corresponding to Detector is saturated (65533) or Aggregation algorithm failure (65528). Replace these values with maximum allowed scaled integer (from valid_range attribute).")
23
Response vs. Scan Angle (Band 35, 13.9 m)
Scan mirror reflectance, emissivity, or polarization not characterized correctly as a function of scan angle. Correction is possible, but complicated.

24
Band 26 Optical Leak Photons intended for Band 5 detectors (1.24 m) leak into Band 26 (1.38 m) detectors. Correction is operational.

25
Band 26 Corrected Detector dependent correction factors remove the land surface contribution and reduce striping.

26
MODIS Performance

27
MODIS Performance cont.

28
MODIS Performance cont.

29
Destriping

30
MODIS LWIR Destriping Investigation
LWIR L1B image artifacts are introduced by: Mirror sides not characterized perfectly Detectors calibrated independently Detectors "out of family” For all MOD021KM granules on 2001/06/04, extracted successive 100 x 100 boxes of pixels at nadir (5760 samples), and for each box computed (in radiance units): Overall mean and standard deviation Mean and standard deviation for each mirror side Mean and standard deviation for each detector For uniform boxes (low standard deviation): Selected reference detector Computed ratio of each detector to the reference
, and for each box computed (in radiance units): Overall mean and standard deviation. Mean and standard deviation for each mirror side. Mean and standard deviation for each detector. For uniform boxes (low standard deviation): Selected reference detector. Computed ratio of each detector to the reference.")
34
MODIS Band 27 (6.7 m), :45 UTC Original L1B (V003) Destriped
, :45 UTC Original L1B (V003) Destriped")
35
MODIS Band 30 (9.6 m), :45 UTC Original L1B (V003) Destriped
, :45 UTC Original L1B (V003) Destriped")
36
Terra MODIS with Destriping

37
Aqua MODIS without Destriping

38
MODIS LWIR Destriping Challenges
Time dependence: Corrections for Jun do not work as well in Dec. 2000 Need to analyze a series of months to ascertain time dependence Dealing with remaining artifacts: Bands dominated by noise (e.g. band 34) require image processing Some detectors must be replaced (replicate or interpolate?) Need to investigate scene dependence of detector ratios (currently assume same correction applies for all scene temperatures) Real-time monitoring: Implement destriping corrections on UW direct broadcast data, based on analysis on latest 7 days of overpasses Allows monitoring of changes in detector corrections over time
 require image processing. Some detectors must be replaced (replicate or interpolate ) Need to investigate scene dependence of detector ratios (currently assume same correction applies for all scene temperatures) Real-time monitoring: Implement destriping corrections on UW direct broadcast data, based on analysis on latest 7 days of overpasses. Allows monitoring of changes in detector corrections over time.")
Similar presentations


 Stray Light Correction Approach>")


>")

