Download presentation
Presentation is loading. Please wait.

1
6 TH ANNUAL CONFERENCE

2
Performance Based Maintenance Results Tim Lattner, P.E. Director, Office of Maintenance, Florida Department of Transportation

3
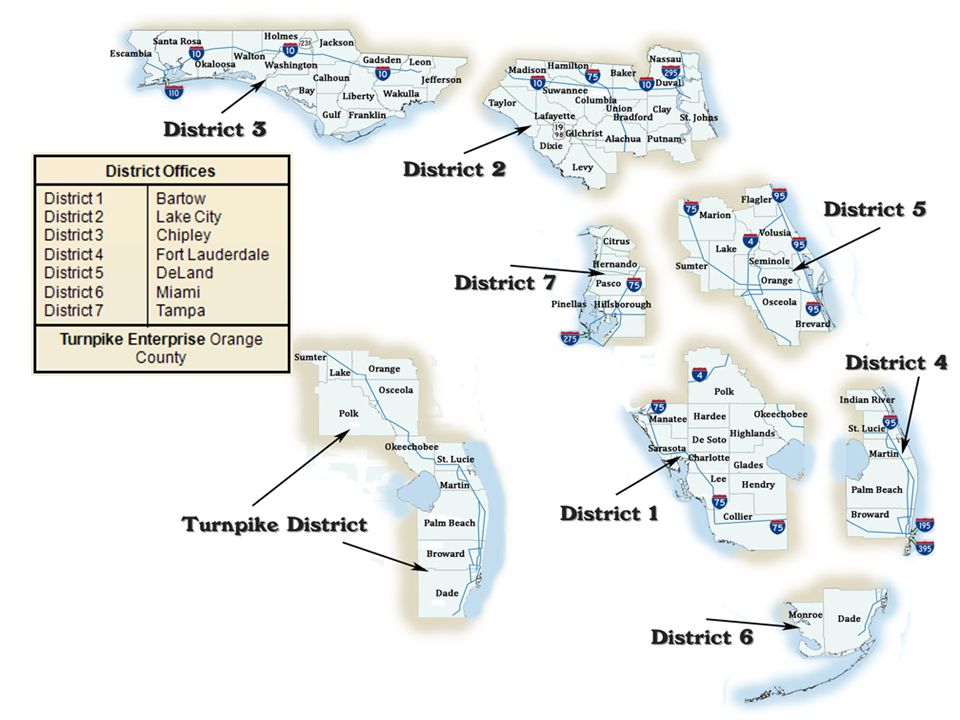
Florida State Roadways 12,076 Centerline Miles 43,138 Lane Miles 6,638 Bridges Maintained 11,906 Bridges Inspected 65 Rest Areas & Welcome Centers 24 Truck Comfort & Weigh Stations

5
Performance Based Contracts Asset Maintenance Contracts Focused Performance Contracts – Lighting; Striping; Pond Maintenance; Sidewalk; Aesthetics Memorandums of Agreement – Lighting; Signals; Landscaping

6
Management Approach for Performance Based contracts Do not provide “to do” or “work needs” lists or “deficiency survey” results We cannot direct them on what to do Things may not be corrected as quickly as you like We may not be have the same ability to respond to “high profile” complaints Need to hold them to the performance measures in the contract

7
Expect Contractors on Performance Based contracts to: Determine what needs to be done Meet performance measures by performing consistent maintenance Take full responsibility Take pride in the condition of “their” assets

8
Key Elements to Measuring results of Performance Based contracts Cost comparison MRP results Contract performance results (AMPER)
")
9
FY 2012/2013 Expenditures

11
Performance Based Striping contracts Contract #Office Contract Start Date Miles of Striping Awarded AmountCalculated Cost* Reductions in Compensation Previously Assessed Total for 5 years$/Miles of StripingTotal for 5 Years $/Miles of Striping E5P91Leesburg4/26/2012341$1,667,790.00$4,890.88$1,979,747.70$5,805.71 E5P96Ocala9/6/20121210$2,842,200.00$2,348.93$5,638,241.35$4,659.70 $18,948.00 Lane User Fee E5Q42Oviedo11/28/2012488$2,563,000.02$5,252.05$3,062,524.31$6,275.66 E5Q65Orlando1/16/2013825$2,580,000.00$3,127.27$2,125,428.03$2,576.28 $28,000.00Deficiencies E5Q37Leesburg3/25/2013627$2,476,000.02$3,948.96$5,061,057.72$8,071.86 E5Q60Brevard5/15/2013466$1,332,000.00$2,858.37$2,476,287.60$5,313.92 E5Q49DeLand6/16/20131390$1,294,215.96$931.09$4,070,575.67$2,928.47 E5Q75Oviedo11/7/2013435$889,699.02$2,045.29$2,421,762.18$5,567.27 E5Q74DeLand12/6/2013618$1,025,835.18$1,659.93$3,494,875.09$5,655.14 $16,670,740.20$30,330,499.65 E1J02Sebring8/3/20111029$3,540,180.00$3,440.41$4,419,870.39$4,295.31 $ 531,027.00 Deficiencies/ lost payments E1M77Sarasota1/12/20141736$1,883,333.35$1,084.87$6,284,478.68$3,620.09 $ - $5,423,513.35$10,704,349.07 Grand Total$22,094,253.55$41,034,848.72 *"Calculated Cost" based on: Replacing all stripes with Thermo one (1) time Replacing all RPMs 2.5 times 5% for Mobilization 5% for MOT Running the MRU 6 times at $14.90/mile of stripe each time Total estimated savings over 5 years $18,940,595.17 E1J02* Minimum 400 mcd/lx-m2 (white) and 300 mcd/lx-m2 (yellow), other lines and symbols 175 mcd/lx-m2. Testing required each quarter. Must achieve minimum of 80 on RPM, striping and symbol characteristics each period. Additional quarterly evaluation performed by contractor each quarter to MRP requirements. E1M77* Contract requirements are based on MRP testing results (minimum of 80 on striping and RPM) This is a 3 year contract. Contract amount was extrapolated to 5 years but may not represent actual 5 year contract cost.
 This is a 3 year contract. Contract amount was extrapolated to 5 years but may not represent actual 5 year contract cost..")
12
Maintenance Rating Program Results Statewide MRP for FY 13-14 – 86 Statewide MRP for FY 13-14 for AM areas (not apples to apples comparison) – 87
 – 87")
13
Asset Maintenance Contractor Performance Evaluation Report AMPER

14
Asset Maintenance Contractor Performance Evaluation Report Grades contractor performance using a standard, established, thorough process Generates a numeric 0-100 score with 70 being threshold of acceptable performance Results are used for matters of Default, Non- Responsibility and Contractor selection for future jobs

16
Contractor Performance

17
AM Program Growth

18
Questions ?

Similar presentations


 (WAC 136 – 11) Larry Pearson, Maintenance Programs Manager.>")

