Download presentation
Presentation is loading. Please wait.

1
Dr. Katie Cahill Science 295

2
The History of Ergonomics Foundations of ergonomic science observed in Ancient Greece - Hippocrates - Egyptian Dynasties Term coined during World War II by Hywel Murell Continued with the space age Further developed during the information age

3
What is Ergonomics? AKA Human Factors Derived from Greek words ergon (work) and nomos (law) According to the IEA, ergonomics is the scientific discipline concerned with understanding of interactions among humans and other elements of the system, and the profession that applies theory, principles, data and methods to design, in order to optimize human well being and overall system performance.
 and nomos (law) According to the IEA, ergonomics is the scientific discipline concerned with understanding of interactions among humans and other elements of the system, and the profession that applies theory, principles, data and methods to design, in order to optimize human well being and overall system performance..")
4
What is Ergonomics? Main focus is the safety of the person Factors: Body posture and movement Environmental factors Work Organization Interdisciplinary approach - biomechanics, physiology, psychology, mechanical engineering, industrial design, information technology and management

5
So what? Social Value Human well being, safety, health and comfort Reduces accidents at work, at home, etc. by reducing human error Improves relationship between operators and equipment Decreases absence from work Diseases of musculoskeletal system (LBP) Psychological illnesses (stress) User friendly products
 Psychological illnesses (stress) User friendly products.")
6
So what? Economic Value Reduction of costs by preventing work related problems Health care costs for treatment Costs associated with loss of labor Companies can improve efficiency, worker productivity and cost reduction Ergonomically designed products deliver benefits to customers and edge out competition Special situations – short vs. tall, overweight, handicapped, elderly, pregnant women

7
Section I: The Human Body All humans have similar bodies Bodies of people evolve to meet special circumstances Unique climates, special diets, athletic training Differences in bodies within the species of mankind Recognize these differences to accommodate individuality The following chapters address these differences: Chapter 1 Body Sizes Chapter 2Mobility Chapter 3 Muscular Work Chapter 4 Body strength and load handling

8
Body Sizes Body sizes differ Growth cycle: quick growth during childhood, consistency for 20 – 40 years, degenerative changes Men are normally taller than women Taller and shorter individuals Differing body proportions

9
The Earth’s Populations Bodies of populations described in height and weight Table 1.1 Average stature of 20 regions Anthropometrics – study of the size and proportion of the body Why is it important to know the variances in body stature?

10
How to measure May need more specific measurements than just height and weight Traditional method – taking measurements with hand held devices Emerging technique records 3D dimensions of the human body Figure 1.1 = most common measurements taken Table 1.3 use of the measurements Data is missing from many populations due to its laborious and expensive nature

11
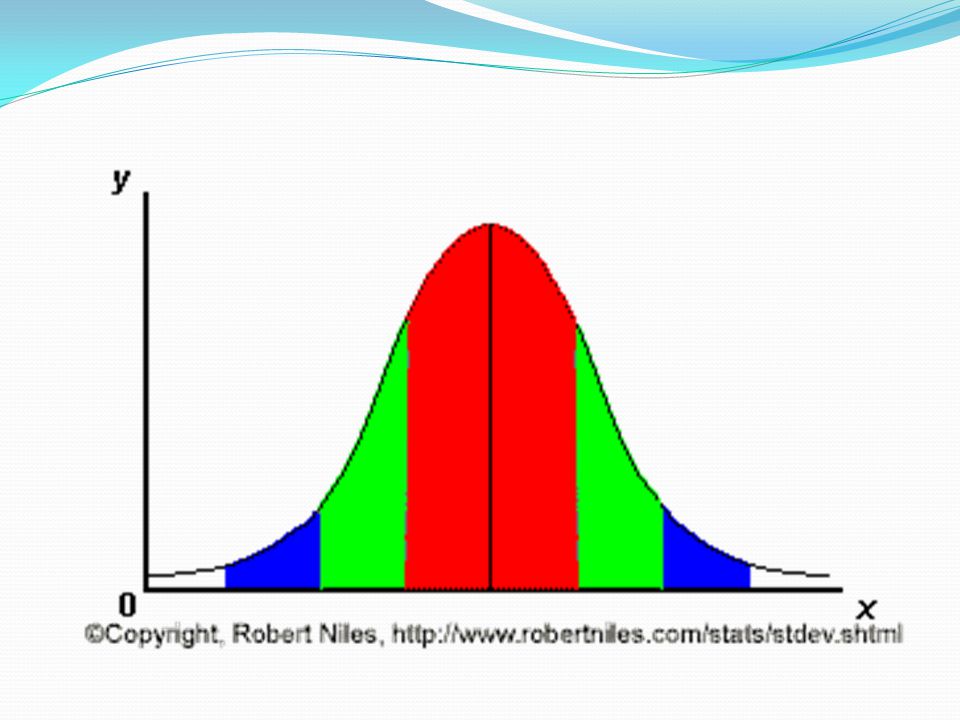
No “Average Person” Problems with average data Can’t base designs of the average because too small for some and too large for others Need to take into account the extremes Need to understand the “normal” distribution Statistically analyze a distribution curve “bell cure” or Gaussian curve Majority cluster in the middle and outliers on either end represent extremes

12
Normal Distribution Curve

13
Average and Standard Deviation Average is the measure of the middle or expected value of a data set The standard deviation is a statistic that tells you how tightly all the various examples are clustered around the mean in a set of data With tightly bunched data, the bell-shaped curve is steep, the standard deviation is small With spread apart data, the bell curve is relatively flat, the standard deviation is large Smaller SD = more reliable data

15
Percentiles Numerical value of a specific point in a distribution calculated from the mean and the standard deviation The mean is normally in the fiftieth percentile range; half the data lies above and half below Fifth percentile is of design interest: 95% p5 is 1.65 SD below the mean and p95 is 1.65 SD above the mean Table 1.6 Values necessary to calculate percentage points

16
Hand Size Data Figure 1.3 and Table 1.7 Hand measures Length Breadth of knuckles Maximal breadth Circumference at knuckles Wrist Circumference

17
Designing to Fit the Body Even among seemingly similar groups, body sizes and segments differ Ex 1 US agriculture workers are shorter by an average of 2.5 cm than other workers Ex 2 Female American agriculture workers have larger waist circumferences than other occupations Ex 3Protective Service workers are taller and heavier

18
Design Principles 1. Custom fit each individual 2. Have several fixed sizes 3. Make it adjustable 4. Design for the extreme bodies; assures any individual can: Operate a gadget Fit through any opening Cannot pass through a dangerous opening 5. Select those persons whose bodies fit the existing design

19
Fit a Range Solutions 2 and 3 are the most common Allows us to select a body size range we intend to accommodate Aim to accommodate the central 90% Exclude the top and bottom 5%; total 10% extreme sizes

20
Select Design Limits Minimum and maximum depend on design purpose Several sizes (solution 2) Ready made clothing Adjustment features within a range (solution 3) Shoes with laces Office chairs Statics and dynamics Data collected is often in a static position Movement must be taken into account with designs (Table 1.8)
 Ready made clothing Adjustment features within a range (solution 3) Shoes with laces Office chairs Statics and dynamics Data collected is often in a static position Movement must be taken into account with designs (Table 1.8)")
21
Summary Fitting equipment and tasks to individuals requires: Anthropometric data Proper procedures Data is available on many populations, missing data must be estimated Design procedures often involve selection of middle range of the normal curve to accommodate the majority of the population

Similar presentations


 is the scientific discipline.>")


 + metrein (to measure) The study of how people vary in Visual acuity Determination Upper back strength Age Leg length Initiative.>")


