Download presentation
Presentation is loading. Please wait.

1
American Petroleum Institute Energy Community in Depth December 3, 2014

2
Many Factors Impact Prices

3
Price Follows Crude (Source: EIA)
")
4
What Consumers are Paying at the Pump (June 2014) Source: EIA estimate based on average price of $3.69 per gallon, June 2014.
 Source: EIA estimate based on average price of $3.69 per gallon, June 2014.")
5
Who Owns the Oil Industry?

6
Earnings

7
Return on Investment

8
Indiana consumes almost three times as much energy as it produces Trillion Btu Source: EIA, State Energy Profiles, 2012

9
Future U.S. Energy Demand

10
Growing Global Energy Demand

11
Risks to the Development of Oil and Natural Gas

12
The Myth of “Big Oil”

13
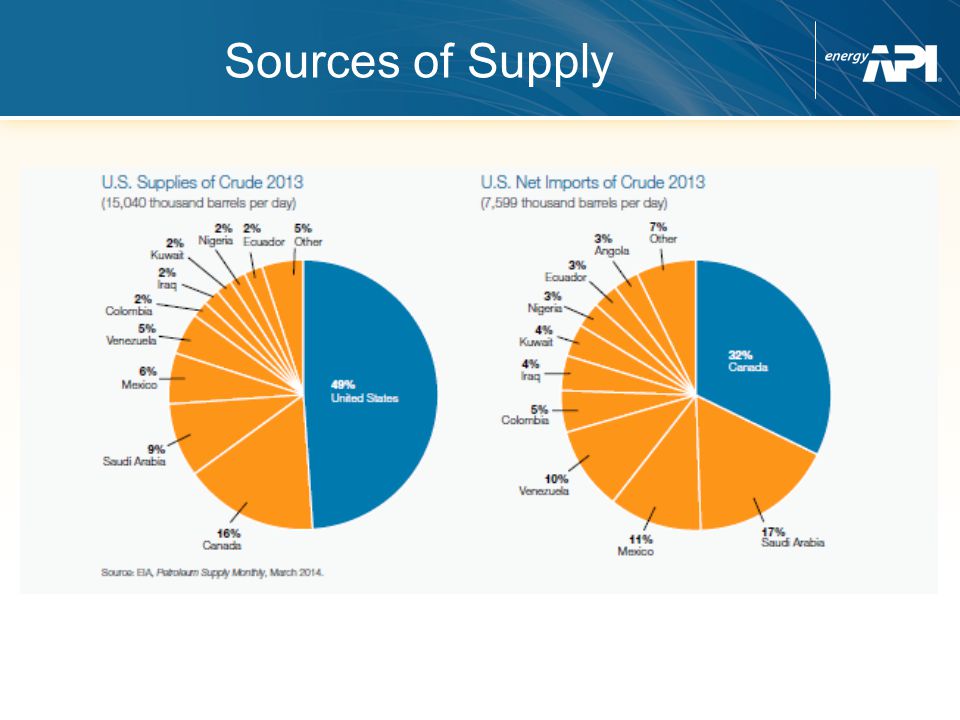
Sources of Supply

15
Largest Oil Companies

17
Shale

18
Indiana Crude Oil Production (thousands of barrels per day) Indiana Natural Gas Marketed Production (millions of cubic feet) Indiana’s crude oil production is falling but natural gas is taking off Source: EIA
 Indiana Natural Gas Marketed Production (millions of cubic feet) Indiana’s crude oil production is falling but natural gas is taking off Source: EIA")
19
Industrial production benefits from strong growth in shale gas production Lower natural gas prices lower costs of both raw material and energy Chemical and fertilizer facilities are seeing increased utilization with lower natural gas prices Energy-intensive industry can be more competitive in the global market Industrial production expands in response to competitive advantage of low natural gas prices

20
Shale energy revolution has pronounced impact on energy-intensive industries Source: IHS Global, “America’s New Energy Future, Volume 3: A Manufacturing Renaissance.” Percent Increase to Industrial Production Indices due to the Unconventional Activity Value Chain

21
IndustryEmploymentLabor Income ($ millions) Value Added ($ millions) Oil and natural gas industry39,628$2,168.1$8,910.0 Services40,081$1,587.2$1,875.8 Finance, insurance, real estate, leasing15,190$724.5$1,881.2 Manufacturing13,542$960.7$1,679.0 Wholesale and retail trade12,639$465.4$764.7 Construction5,083$280.8$310.3 Transportation and warehousing4,768$233.6$335.7 Information2,522$137.4$439.8 Agriculture1,684$45.6$94.3 Utilities495$57.0$228.6 Mining306$23.6$51.5 Other428$15.1$24.8 Total economic impact136,366$6,699.1$16,595.7 As a % of state total3.8%4.1%6.3% The economic impacts of the oil and natural gas industry on Indiana’s economy by industry Source: PWC, “Economic Impacts of the Oil and Natural Gas Industry on the US Economy in 2011,” July 2013. Figures are for the year 2011.

22
Economic impact of unconventional oil and gas development on Indiana 201220202035 Employment15,97327,30333,366 Value Added (millions $)$1,667$2,768$3,414 Federal Taxes State & Local Taxes (millions $) $219 $159 $369 $244 $456 $265 Source: IHS Global Insight, “America’s New Energy Future: The Unconventional Oil and Gas Revolution and the US Economy,” December 2012.
$1,667$2,768$3,414 Federal Taxes State & Local Taxes (millions $) $219 $159 $369 $244 $456 $265 Source: IHS Global Insight, America’s New Energy Future: The Unconventional Oil and Gas Revolution and the US Economy, December 2012.")
23
On energy last year, enough to employ over 350 teachers (IHS Global Insight) Big savings for Indiana school districts
 Big savings for Indiana school districts")
24
On energy last year, enough to employ about 87 government workers (IHS Global Insight) Big savings for Indiana state and local governments
 Big savings for Indiana state and local governments")
25
American consumers’ annual savings due to lower gas prices resulting from shale energy development (IHS Global Insight) More energy can lead to American prosperity
 More energy can lead to American prosperity")
26
Oil and natural gas industries support 136,400 jobs (3.8% of Indiana’s total employment) Jobs supported by new technolgies : 15,973 Expected to grow by 27, 303 in 2020 and 33,366 in 2036 INDIANA SPECIFIC JOBS
 Jobs supported by new technolgies : 15,973 Expected to grow by 27, 303 in 2020 and 33,366 in 2036 INDIANA SPECIFIC JOBS")
27
LET’S TALK YOUR TURN

29
US Environmental Expenditures

31
Pipelines 99.999 % safety record 62 % reduction in releases from liquid pipeline since 2001-2012 Almost 70,000 miles of petroleum pipeline operating in the U.S. $1.6 B spent annually on inspections and safety

32
Pipelines & Rail " U.S. freight railroads are estimated to have carried 434,000 carloads of crude oil in 2013 (roughly equivalent to 300 million barrels)” (Source: Congressional Research Service). That's 691 barrels per rail car. A grain rail car carries 3200 bushels of corn.
 (Source: Congressional Research Service). That s 691 barrels per rail car. A grain rail car carries 3200 bushels of corn..")
33
Pipelines & Rail Each 100,000 barrels per day of new pipeline capacity displaces 14.7 rail cars per day. In corn equivalent that's 14.7 X 3200 = 463,096 bushels per day. 169,030,390 bushels of corn per year.

34
Oil Sands Crude Does not contain tar or sand Is comparable to other heavy crudes Does not run hotter Has been shipped by pipeline since the early 1980’s Does provide over half of the crude consumed in Minnesota

35
Bakken 1 MM bbl/d production 30 years in production Light crude Both traditional and fracking Sand mining

36
Kalamazoo Spill

38
Gasoline Price Projections

39
Diesel Projections

40
Natural Gas Projections

41
For more information visit: www.api.org www.energytomorrow.org www.energycitizens.org

Similar presentations


 could.>")


 CSX Transportation – serves every major population and industrial center east of the Mississippi;>")
