Download presentation
Presentation is loading. Please wait.

1
© Crown copyright Met Office Impact experiments using the Met Office global and regional model Presented by Richard Dumelow to the WMO workshop, Geneva, 19 th May 2008

2
© Crown copyright Met Office Collaborators Keir Bovis Gareth Dow Richard Dumelow Bruce Ingleby Bruce MacPherson et al

3
© Crown copyright Met Office Contents This presentation covers the following areas : Space-terrestrial link Global data denial Data targeting Increasing the use of surface data Observation impact experiments in the regional models

4
© Crown copyright Met Office Space-terrestrial link Richard Dumelow

5
© Crown copyright Met Office Conventional observations in baseline

6
© Crown copyright Met Office Space-terrestrial runs Baseline with all satellite data, buoy data, GUAN and GCOS stations (BASE). Baseline + all other data (COMB). Baseline + all aircraft data (BPAIR) Baseline + all non-GUAN radiosonde T, v (BPGTW) Baseline + all non-GUAN radiosonde v
. Baseline + all aircraft data (BPAIR) Baseline + all non-GUAN radiosonde T, v (BPGTW) Baseline + all non-GUAN radiosonde v.")
7
© Crown copyright Met Office Space-terrestrial – experimental set up Winter and summer periods: Winter period: 4/12/04 -> 27/01/05. Summer period: 5/7/05 -> 15/9/05. Global and limited area (NAE) model used. 4D-Var in global and 3D-Var in NAE. 6-day forecasts from 00 UTC and 12 UTC. Verification against observations and COMB analysis.
 model used. 4D-Var in global and 3D-Var in NAE. 6-day forecasts from 00 UTC and 12 UTC. Verification against observations and COMB analysis..")
8
© Crown copyright Met Office North Atlantic European (NAE) area
 area")
9
© Crown copyright Met Office COMB vs BASE T+48 T+144

10
© Crown copyright Met Office Winter Summer Northern hemisphere RMS error with height vs analysis Temperature Wind COMB vs BASE Global model

11
© Crown copyright Met Office Temperature Wind Winter Summer NAE model RMS error with height over Europe vs radiosondes COMB vs BASE

12
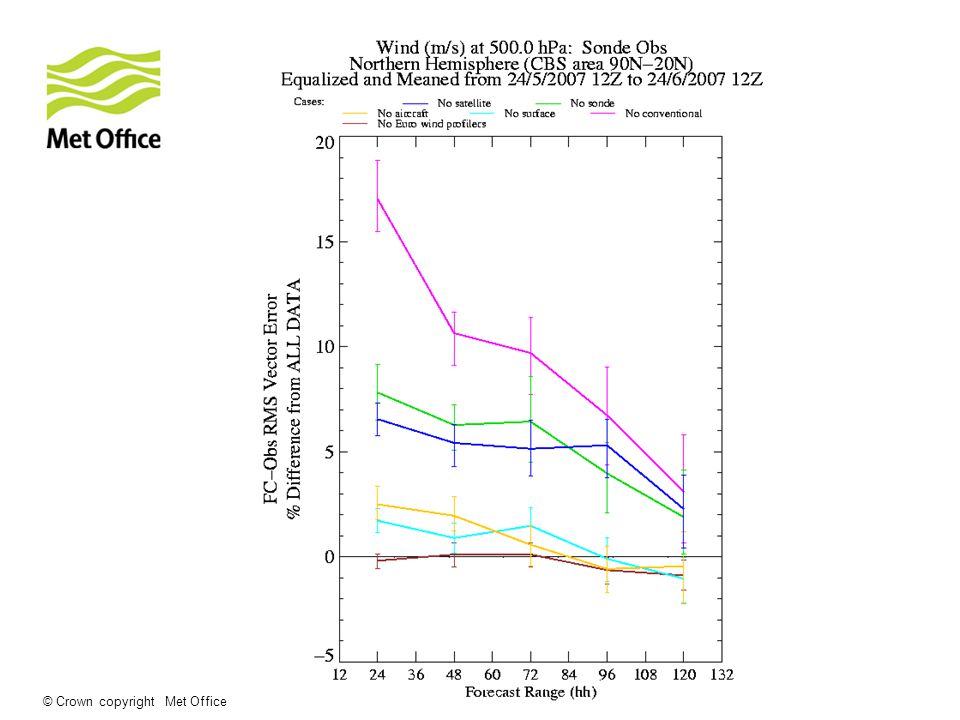
© Crown copyright Met Office Temperature Wind Winter Summer COMB vs ALL Global model Northern hemisphere RMS error vs analysis at 500 hPa

13
© Crown copyright Met Office Temperature Wind Winter Summer COMB vs ALL NAE model RMS error over Europe vs radiosondes at 500 hPa

14
© Crown copyright Met Office Global data denial Richard Dumelow

15
© Crown copyright Met Office Global denial experiment Met Office operational system as at October last year. Full resolution, 4D-Var. Forecasts from 12UTC out to 5 days. Verification of standard fields against observations and ‘All data’ analysis. One month summer period: 24/5/07 -> 24/6/07.

16
© Crown copyright Met Office Global data denial runs 1.All data 2.All data – all satellite 3.All data – all radiosonde 4.All data – all aircraft 5.All data – all surface 6.All data – all conventional (satellite only) 7.All data – European wind profilers
 7.All data – European wind profilers")
17
© Crown copyright Met Office

21
Targeting Experiments Keir Bovis, Gareth Dow, Richard Dumelow

22
© Crown copyright Met Office Targeting experiments ‘Subjective’ targeting ‘Objective’ targeting ‘Real’ targeting

23
© Crown copyright Met Office Subjective targeting – OSE BASE+ALL 87 Sonde Stations in Total Verification Region

24
© Crown copyright Met Office Subjective targeting – OSE BASE 17 Stations in Total (~ 1 per 10 o Box) (none in verification region) Verification Region
 (none in verification region) Verification Region")
25
© Crown copyright Met Office Subjective targeting – OSE BASE+UPS 27 Stations in Total (17 Baseline + 10 Upstream)
")
26
© Crown copyright Met Office Subjective targeting – results, T+12 and T+24 temperature VERIF UPS VERIF UPS

27
© Crown copyright Met Office Subjective targeting – case study: (ex-)Hurricane Rita Track of Hurricane Rita Verification Region 12Z 24 th 960 hPa
Hurricane Rita Track of Hurricane Rita Verification Region 12Z 24 th 960 hPa")
28
© Crown copyright Met Office Subjective targeting – case study results: T+12 MSLP forecasts for 12Z 24 th Sep Sparse network incorrectly locates Hurricane Rita and underestimates it’s intensity BASE+ALL (958 hPa) BASE (983 hPa) X marks NHC best estimate of Rita’s central position (960 hPa)
 BASE (983 hPa) X marks NHC best estimate of Rita’s central position (960 hPa)")
29
© Crown copyright Met Office Objective targeting – the main elements in observation targeting Adapted from Doerenbecher et. al., 2004.

30
© Crown copyright Met Office Objective targeting - results Objective targeting match or out-perform performance at target forecast range of subjective approaches.

31
© Crown copyright Met Office Objective targeting - results OSET+12T+24T+36T+48 base+T3690%85%60%50% ETKF(48)75% 70%55% ETKF(24)75% 45% Table shows the percentage number of forecast fields with a reduced forecast RMS error compared to corresponding fields in OSE base+ups used as a baseline. Objective targeting using ETKF with shortest lead time (ETKF(24)) shows the best performance at the target forecast range 36 hours. Results for subjective targeting (base+T36) are improved in the short-range highlighting the variability of approach with less accurate flow analyses. Target forecast range
) shows the best performance at the target forecast range 36 hours. Results for subjective targeting (base+T36) are improved in the short-range highlighting the variability of approach with less accurate flow analyses. Target forecast range.")
32
© Crown copyright Met Office The Greenland Flow Distortion Experiment (GFDex) – real targeting Ian Renfrew, University of East Anglia Sue Gray, University of Reading Targeted observations comprise dropsondes deployed from the FAAM aircraft in sensitive areas identified on targeting guidance. Met Office targeting guidance is produced twice a day using the Ensemble Transform Kalman Filter (ETKF) with different lead and optimisation times. 48 36 24482460 48 36 24 36 Opt Time Lead Time Opt Time Lead Time 12Z00Z
 with different lead and optimisation times Opt Time Lead Time Opt Time Lead Time 12Z00Z.")
33
© Crown copyright Met Office GFDex targeting cases - (24 February 2007 - 10 March 2007)
")
34
© Crown copyright Met Office GFDex OSE impact – headline results Verification over NW Europe and UKVerification over Scandinavia Two verification regions were identified, NW Europe (inc. UK) shown in blue and Scandinavia shown in red.
 shown in blue and Scandinavia shown in red..")
35
© Crown copyright Met Office Increasing the use of surface data Bruce Ingleby

36
© Crown copyright Met Office Met Office usage of Synops to March 2008 Global: P* (Ships P*, wind) Use hourly Synops (3 hour window) (2007) LAMs: P*, T, RH, wind, log(vis) - hourly LAM height limit for T, RH 200 → 500 (2003) Obs monitoring by station with monthly updates to rejections and pressure correction Improvements in resolution and land surface modeling improve O-B and make global assimilation of Synop T/RH/wind feasible
 Use hourly Synops (3 hour window) (2007) LAMs: P*, T, RH, wind, log(vis) - hourly LAM height limit for T, RH 200 → 500 (2003) Obs monitoring by station with monthly updates to rejections and pressure correction Improvements in resolution and land surface modeling improve O-B and make global assimilation of Synop T/RH/wind feasible")
37
© Crown copyright Met Office Met Office usage of Synops from 2 April 2008 Synop: P*, T, RH, wind † (6 hr window) - hourly dht=(stn height-model height): limit for T, RH, wind of ±500m (-500 to 250m at night) † Tropical and unresolved island winds omitted RH height adjustment of 0.01%/m Wind speed scaling for dht > 100 m Ship/Buoy: P*, wind, T, RH used hourly Drifting buoy still limited to P* Nudging of soil temperatures Gl/LAM usage v. similar now, Gl changes red

38
© Crown copyright Met Office 4D-Var June 2007, Opt 1 & 2

39
© Crown copyright Met Office Ver vs Synop T: NH and SH

40
© Crown copyright Met Office Observation impact experiments in the regional models Bruce MacPherson et al

41
© Crown copyright Met Office Regional model impacts Positive impact from: Weather radar winds Cloud Visibility

42
© Crown copyright Met Office Weather radar – VAD winds Currently assimilated 61 rejected 26

43
© Crown copyright Met Office VAD wind impact experiment 3-week 24km NAE 4DVAR test, autumn 2006 CNTL noVAD mean pmsl rms pmsl

44
© Crown copyright Met Office VAD wind impact experiment Pmsl benefit statistically significant when error bars computed for mean difference in CNTL / noVAD errors

45
© Crown copyright Met Office Cloud assimilation MOPS cloud data impact of nudging scheme significant benefit in Sc episodes (eg Feb ’06) NO MOPS cloud Control rms T2mrms cloud cover One week UK Mes Trial
 NO MOPS cloud Control rms T2mrms cloud cover One week UK Mes Trial")
46
© Crown copyright Met Office Spring 2005 4D-Var VIS v NO VIS

47
© Crown copyright Met Office Summary of main results

48
© Crown copyright Met Office Main results from Met Office impact studies The space-based system has become increasingly important. The conventional (ground based) observing system is an essential compliment to the space-based system. Upstream targeting is effective but getting a large positive impact from North Atlantic targeted observations over Europe is difficult. In-situ observations of surface parameters have positive impact particularly in higher resolution models.
 observing system is an essential compliment to the space-based system. Upstream targeting is effective but getting a large positive impact from North Atlantic targeted observations over Europe is difficult. In-situ observations of surface parameters have positive impact particularly in higher resolution models..")
49
© Crown copyright Met Office Questions and answers

Similar presentations


 Bruce Macpherson Mesoscale Assimilation, NWP Met Office EWGLAM / COST-717.>")


 Assimilation of GOES Hourly and Meteosat winds in the NCEP Global.>")


