Download presentation
Presentation is loading. Please wait.

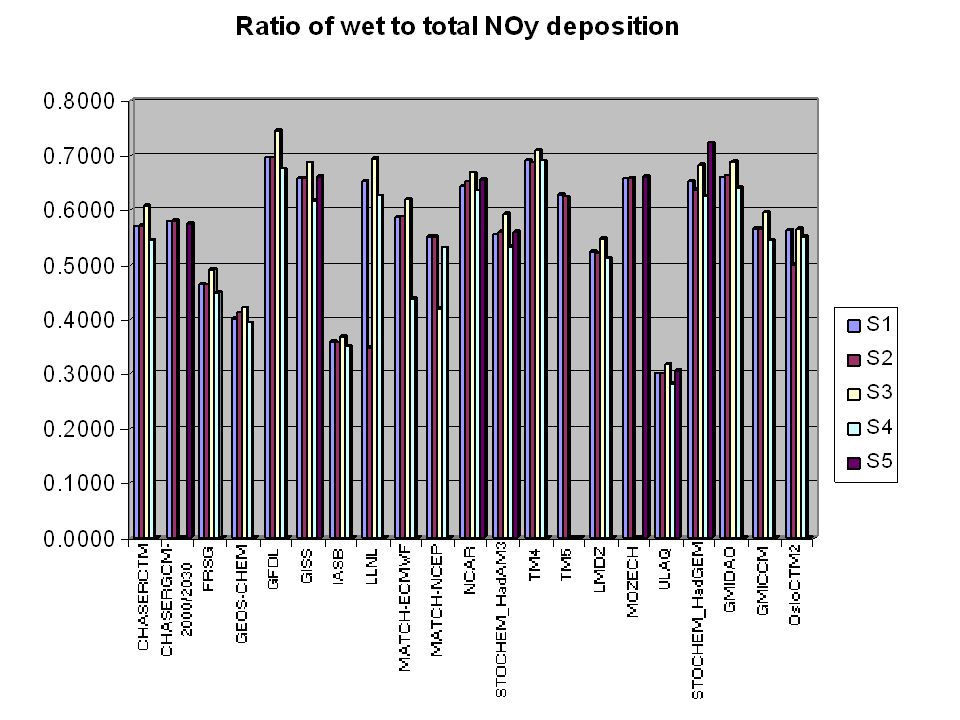
1
Nitrogen deposition on regional and global scales: a multi-model evaluation F.J. Dentener 1, J. Drevet 2, D.S. Stevenson 3, K. Ellingsen 4, T.P.C. van Noije 5, M.G. Schultz 6, C.S. Atherton 7, N. Bell 8, T. Butler 9, B. Eickhout 10, A.M. Fiore 11, J. Galloway 12, C. Galy-Lacaux 13, U.C. Kulshresta 14, J.-F. Lamarque 15, V. Montanaro 16, J.-F. Müller 17, J.M. Rodriguez 18, M.G. Sanderson 19, N.H. Savage 20, S. Szopa 21, K. Sudo 22, O. Wild 22, G. Zeng 20 1. JRC, Ispra, Italy. 2. EPFL, Lausanne, Switzerland. 3. University of Edinburgh, UK 4. University of Oslo, Norway. 5. KNMI, De Bilt, The Netherlands. 6. MPI-Met, Hamburg, Germany. 7. LLNL, Livermore, USA. 8. NASA-GISS, New York, USA. 9. MPI-Chem, Mainz, Germany. 10. RIVM, Bilthoven, The Netherlands 11. NOAA GFDL, Princeton, USA. 12. University of Virginia, USA. 13. Observatoire Midi-Pyrénées, France. 14. Indian Institute of Chemical Technology, Hyderabad, India. 15. NCAR, Boulder, USA. 16. Università L'Aquila, Italy. 17. IASB, Brussels, Belgium. 18. GEST, Washington, DC, USA. 19. Met Office, UK. 20. University of Cambridge, UK. 21. LSCE, Gif-sur-Yvette, France. 22. FRSGC JAMSTEC, Yokohama, Japan.

2
Background ‘OxComp’ model intercomparison for IPCC TAR sampled models in ~1999 OxComp focussed on SRES A2 in 2100. Models and emissions have developed in the last 5 years – time for an update New scenarios from IIASA include AQ legislation measures (not in SRES) SRES didn’t include ships – new datasets SRES biomass burning(?) – new satellite data
 SRES didn’t include ships – new datasets SRES biomass burning( ) – new satellite data.")
3
Scope of IPCC-AR4 Chapter 2: Changes in atmospheric constituents and in radiative forcing Chapter 7: Couplings between changes in the climate system and biogeochemistry –Includes a section on Air Quality Design intercomparison to be of direct use to IPCC-AR4

4
ACCENT intercomparison (Expt. 2) Focus on 2030 – of direct interest to policymakers Go beyond radiative forcing: also consider ozone AQ, N- and S-deposition, and the use of satellite data to evaluate models Present-day base case for evaluation: –S1: 2000 Consider three 2030 emissions scenarios: –S2: 2030 IIASA CLE (‘likely’) –S3: 2030 IIASA MFR (‘optimistic’) –S4: 2030 SRES A2 (‘pessimistic’) Also consider the effect of climate change: –S5: 2030 CLE + imposed 2030 climate Future changes in composition related to emissions 1 year runs Future changes in composition related to climate change 5-10 year runs
 Focus on 2030 – of direct interest to policymakers Go beyond radiative forcing: also consider ozone AQ, N- and S-deposition, and the use of satellite data to evaluate models Present-day base case for evaluation: –S1: 2000 Consider three 2030 emissions scenarios: –S2: 2030 IIASA CLE (‘likely’) –S3: 2030 IIASA MFR (‘optimistic’) –S4: 2030 SRES A2 (‘pessimistic’) Also consider the effect of climate change: –S5: 2030 CLE + imposed 2030 climate Future changes in composition related to emissions 1 year runs Future changes in composition related to climate change 5-10 year runs.")
5
Global NO x emission scenarios Figure 1. Projected development of IIASA anthropogenic NO x emissions by SRES world region (Tg NO 2 yr -1 ). CLE SRES A2 MFR 20002030
. CLE SRES A2 MFR")
6
Other emissions categories EDGAR3.2 ship emissions, and assumed 1.5%/yr growth in all scenarios Biomass burning emissions from van der Werf et al. (2003) – assumed these remained fixed to 2030 in all scenarios Aircraft emissions from IPCC(1999) Modellers used their own natural emissions Specified fixed global CH 4 for each case (from earlier transient runs)
 – assumed these remained fixed to 2030 in all scenarios Aircraft emissions from IPCC(1999) Modellers used their own natural emissions Specified fixed global CH 4 for each case (from earlier transient runs).")
7
Requested model diagnostics Monthly mean, full 3-D –O 3, NO, NO 2, CO, OH, … –O 3 budget terms –CH 4 + OH –NO y, NH x and SO x deposition fluxes –T, Q, etc. for climate change runs Daily NO 2 column (GOME comparison) Hourly surface O 3 (for AQ analysis) NETCDF files submitted to central database
 Hourly surface O 3 (for AQ analysis) NETCDF files submitted to central database.")
8
26 Participating Models CHASER_CTM CHASER_GCM FRSGC/UCI GEOS-CHEM GISS GMI/CCM3 GMI/DAO GMI/GISS IASB LLNL-IMPACT LMDz/INCA-CTM LMDz/INCA-GCM MATCH-MPIC/ECMWF MATCH-MPIC/NCEP MOZ2-GFDL MOZART4 MOZECH MOZECH2 p-TOMCAT STOCHEM-HadAM3 STOCHEM-HadGEM TM4 TM5 UIO_CTM2 ULAQ UM_CAM CTMs driven by analyses CTMs driven by GCM output CTMs coupled to GCMs

9
Mean model NOy wet dep (obs. overlain circles)
")
10
Mean model v Obs. HNO 3 Wet dep. EUROPE N. AMERICA E. ASIA AFRICA

11
Taylor plots, HNO 3 wet dep

12
Mean model NHx wet dep (obs. overlain circles)
")
13
Mean model v Obs. NH 4 Wet dep. EUROPE N. AMERICA E. ASIA AFRICA

14
Taylor plots, NH 4 wet dep

15
Different model resolutions 1°x1° 3°x3° 5°x5° Mean model

18
Ratio wet:total NHx deposition

19
Changes in NOy dep 2000-2030, under 3 scenarios IIASA CLE IIASA MFR SRES A2

20
Changes in NHx dep 2000-2030, under 2 scenarios IIASA CLE SRES A2

21
Annual NO emission & NOy deposition (per unit area) by region (mean model)
 by region (mean model)")
22
Annual NH 3 emission & NHx deposition (per unit area) by region (mean model)
 by region (mean model)")
23
Fraction of NOy deposition to natural vegetation, agriculture/urban, soil/desert, and water/ice

24
Fraction of NHx deposition to natural vegetation, agriculture/urban, soil/desert, and water/ice

25
% of natural vegetation with N r dep > 1 g N/m 2 /yr

Similar presentations


 3.1 Model evaluation and current impact 3.1.1 Evaluation of.>")


>")


 comparisons M.J. Evans 1, I Bey 2, A.M. Fiore 3, G. Folberth 2, V. Huijnen 4, S. Koumoutsaris 2, P. Moinat 5, M. Schultz 6, S. Schröder.>")
