Download presentation
Presentation is loading. Please wait.

1
Ch 5 Probability: The Mathematics of Randomness

2
5.1.1 Random Variables and Their Distributions
A random variable is a quantity that (prior to observation) can be thought of as dependent on chance phenomena. Toss a coin 10 times X=# of heads Toss a coin until a head X=# of tosses needed
 can be thought of as dependent on chance phenomena. Toss a coin 10 times. X=# of heads. Toss a coin until a head. X=# of tosses needed.")
3
More random variables Toss a die X=points showing
Plant 100 seeds of pumpkins X=% germinating Test a light bulb X=lifetime of bulb Test 20 light bulbs X=average lifetime of bulbs

4
Types of Random Variable
A discrete random variable is one that has isolated or separated possible values. (Counts, finite-possible values) A continuous random variable is one that can be idealized as having an entire (continuous) interval of numbers as its set of possible values. (Lifetimes, time, compression strength 0infinity)
 A continuous random variable is one that can be idealized as having an entire (continuous) interval of numbers as its set of possible values. (Lifetimes, time, compression strength 0infinity)")
5
Probability Distribution
To specify a probability distribution for a random variable is to give its set of possible values and (in one way or another) consistently assign numbers between 0 and 1 –called probabilities– as measures of the likelihood that be various numerical values will occur. It is basically a rule of assigning probabilities to random events. Roll a die, X=# showing x f(x) /6 1/6 1/6 1/6 1/6 1/6
 consistently assign numbers between 0 and 1 –called probabilities– as measures of the likelihood that be various numerical values will occur. It is basically a rule of assigning probabilities to random events. Roll a die, X=# showing. x f(x) 1/6 1/6 1/6 1/6 1/6 1/6.")
6
Probability Distribution
The values of a probability distribution must be numbers on the interval from 0 to 1. The sum of all the values of a probability distribution must be equal to 1.

7
Example Inspect 3 parts. Let X be the # of parts with defect. Find the probability distribution of X. First, what are possible values of X? (0, 1,2,3)
")
8
When does X take on each value?
Outcome X {NNN} {NND, NDN, DNN} {NDD, DND, DDN} {DDD} If P(D)=0. 5, then P(N)=0.5 We have x f(x)=P(X=x) / / / /8
=0. 5, then P(N)=0.5 We have. x f(x)=P(X=x) 1/8 3/8 3/8 1/8.")
9
Cumulative Distribution Function
Cumulative distribution F(x) of a random variable X is Since (for discrete distributions) probabilities are calculated by summing values of f(x), for a discrete distribution
 of a random variable X is. Since (for discrete distributions) probabilities are calculated by summing values of f(x), for a discrete distribution.")
10
“Defect” Example continued
We had f(0)=1/8, f(1)=f(2)=3/8, f(3)=1/8. Therefore F(0)=f(0)=1/8; F(1)=f(0)+f(1)=1/8+3/8=1/2; F(2)=f(0)+f(1)+f(2)=7/8; F(3)=f(0)+f(1)+f(2)+f(3)=1.
=1/8, f(1)=f(2)=3/8, f(3)=1/8. Therefore. F(0)=f(0)=1/8; F(1)=f(0)+f(1)=1/8+3/8=1/2; F(2)=f(0)+f(1)+f(2)=7/8; F(3)=f(0)+f(1)+f(2)+f(3)=1.")
11
Summaries of Discrete Probability Distributions
Given a set of numbers, for example, S= {1, 1, 1, 1, 3, 3, 4, 5, 5 , 6 } To calculate the average of these 10 numbers, you can use Or you can get it this way

12
Mean or Expectation The above result is the weighted sum of x values:
Weights / / / / /10 f(x) The weights are actually the probability distribution for a random variable X . The weighted sum, 3, is called the mean or mathematical expectation of random variable X.
 The weights are actually the probability distribution for a random. variable X . The weighted sum, 3, is called the mean or mathematical. expectation of random variable X.")
13
Definition Let X be a discrete random variable with probability distribution f(x). The mean or expected value of X is The expectation or mean of a random variable X is the long run average of the observations from the random variable X. The mean of X is not necessarily a possible value for X.

14
Back to “defect” example
What is the average number of defective items we expect to see? X f(x) 0 1/8 1 3/8 2 3/8 3 1/8
 0 1/8. 1 3/8. 2 3/8. 3 1/8.")
15
Variance The mean is a measure of the center of a random variable or distribution X: x= f(x) ¼ ½ ¼ Y: y= g(y) ¼ ½ ¼ Both variables have the same center: 0 Which has a larger variability?
 ¼ ½ ¼. Y: y= g(y) ¼ ½ ¼. Both variables have the same center: 0. Which has a larger variability")
16
Variance Deviation from the center (mean) XX
The average of XX is zero! Consider the weighted average of (XX)2 E(X0)2=(1)(1/4)+(0)(1/2)+(1)(1/4)=1/2 E(Y0)2=(4)(1/4)+(0)(1/2)+(4)(1/4)=2 Y is more variable!
2. E(X0)2=(1)(1/4)+(0)(1/2)+(1)(1/4)=1/2. E(Y0)2=(4)(1/4)+(0)(1/2)+(4)(1/4)=2. Y is more variable!")
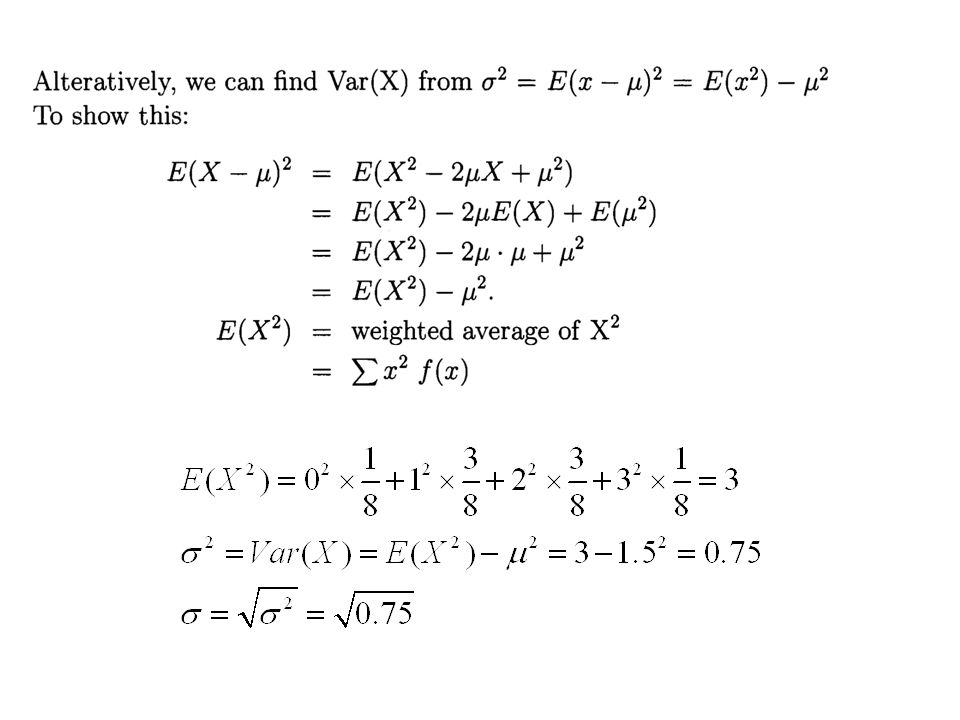
17
Definition Let X be a discrete random variable with probability distribution f(x) and mean The variance of X is The positive square root of the 2 is called standard deviation of X, denoted by .

18
Back to “defect” example
X f(x) 0 1/8 1 3/8 2 3/8 3 1/8
 0 1/8 1 3/8 2 3/8 3 1/8")
20
Binomial Distribution
In many applied problems, we are interested in the probability that an event will occur x times out of n.

21
For example Inspect 3 items. X=# of defects.
D=a defect, N=not a defect, Suppose P(N)=5/6 No defect: (x=0) NNN (5/6)(5/6)(5/6) One defect: (x=1) NND (5/6)(5/6)(1/6) NDN same DNN same Two defect: (x=2) NDD (5/6)(1/6)(1/6) DND same DDN same Three defect: (x=3) DDD (1/6)(1/6)(1/6)
=5/6. No defect: (x=0) NNN (5/6)(5/6)(5/6) One defect: (x=1) NND (5/6)(5/6)(1/6) NDN same. DNN same. Two defect: (x=2) NDD (5/6)(1/6)(1/6) DND same. DDN same. Three defect: (x=3) DDD (1/6)(1/6)(1/6)")
22
Binomial distribution
x f(x) (5/6)3 1 3(1/6)(5/6)2 2 3(1/6)2(5/6) (1/6)3 How many ways to choose x of 3 places for D. __ __ __ [1-P(D)]3- # of D [P(D)]# of D
 0 (5/6)3. 1 3(1/6)(5/6)2. 2 3(1/6)2(5/6) 3 (1/6)3. How many ways to. choose x of 3 places for D. __ __ __. [1-P(D)]3- # of D. [P(D)]# of D.")
23
In general: n independent trials
p probability of a success x=# of successes

24
Roll a die 20 times. X=# of 6’s,
n=20, p=1/6 Flip a fair coin 10 times. X=# of heads

25
More example Pumpkin seeds germinate with probability Plant n=50 seeds X= # of seeds germinating

26
Mean of Binomial Distribution
X=# of defects in 3 items x f(x) (5/6)3 1 3(1/6)(5/6)2 2 3(1/6)2(5/6) (1/6)3 Expected long run average of X?
 0 (5/6)3. 1 3(1/6)(5/6)2. 2 3(1/6)2(5/6) 3 (1/6)3. Expected long run average of X")
27
The mean of a binomial distribution
n= # of trials, p=probability of success on each trial X=# of successes

28
Let’s check this. Use binomial mean formula

29
More examples Toss a die n=60 times, X=# of 6’s known that p=1/6
μ=μX =E(X)=np=(60)(1/6)=10 We expect to get 10 6’s.
=np=(60)(1/6)=10. We expect to get 10 6’s.")
30
Variance for Binomial distribution
σ2=np(1-p) where n is # of trials and p is probability of a success. From the previous example, n=3, p=1/6 Then σ2=np(1-p)=3*1/6*(1-1/6)=5/12
 where n is # of trials and p is probability of a success. From the previous example, n=3, p=1/6. Then. σ2=np(1-p)=3*1/6*(1-1/6)=5/12.")
33
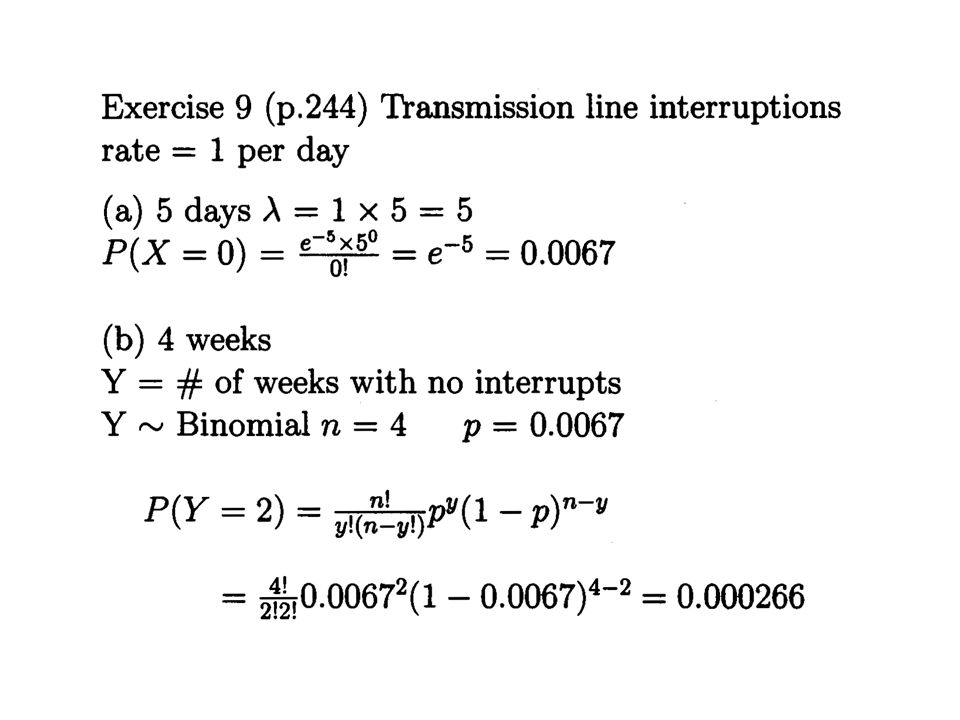
5.1.5 Poisson Distribution It is often useful to define a random variable that counts the number of “events” that occur within certain boundaries. # of defects in an item # of radioactive particles emitted by a substance # of telephone calls received by an operator within a certain time limit.

34
A random variable X with a Poisson distribution takes the values x=0, 1, 2, 3,… with a probability distribution function

36
Exercise The number of monthly breakdowns of the kind of computer used by an office is a random variable having the Poisson distribution with λ=1.6. Find the probabilities that this kind of computer will function for a month Without a breakdown; With one breakdown; With two breakdowns.

37
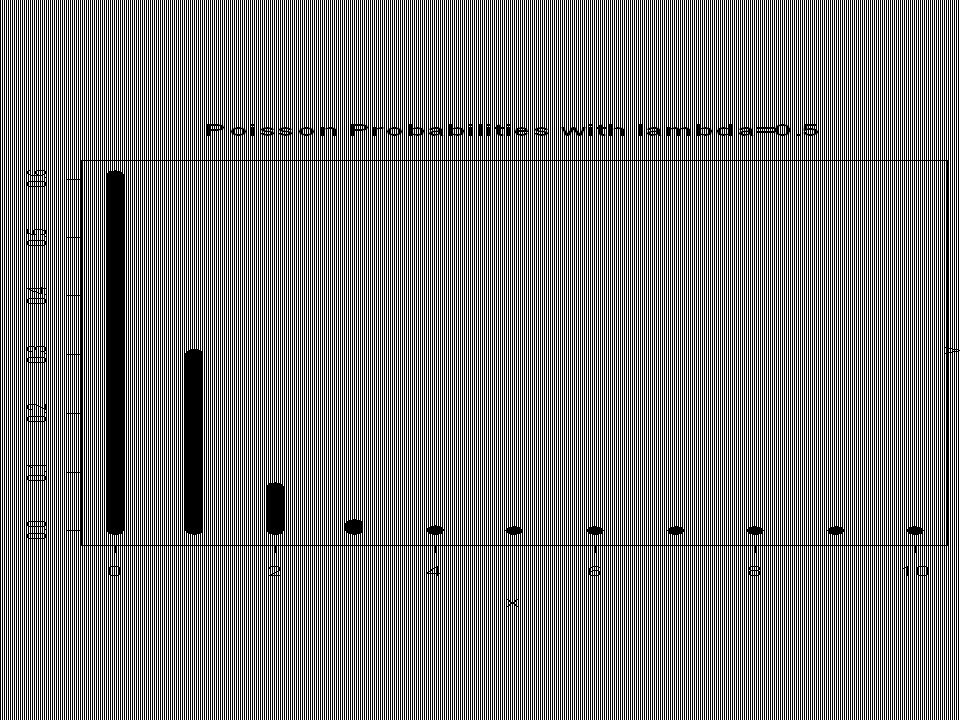
Glass Sheet Flaws Example
A quality inspector at a glass manufacturing company inspects sheets of glass to check for any slight imperfections. Suppose that the number of these flaws in a glass sheet has a Poisson distribution with parameter λ=0.5. (This implies that the expected number of flaws per sheet is only 0.5.)
")
38
1) What is the probability that there are no flaws in a sheet
1) What is the probability that there are no flaws in a sheet? (percentage of the glass sheets in “perfect condition” So about 61% of the glass sheets are in “perfect” condition.
 What is the probability that there are no flaws in a sheet (percentage of the glass sheets in perfect condition So about 61% of the glass sheets are in perfect condition.")
39
2) Sheets with 2 or more flaws are scrapped by the company
2) Sheets with 2 or more flaws are scrapped by the company. Find this probability. About 9% of the glass sheets need to be scrapped and recycled through the company’s manufacturing process.
 Sheets with 2 or more flaws are scrapped by the company. Find this probability. About 9% of the glass sheets need to be scrapped and recycled through the company’s manufacturing process.")
41
3) Looking at 3 sheets of glass, what is the probability that we can find a total of 4 flaws?
This is a new Poisson random variable. λ=1.5

42
Something to think about:
How many sheets of glass we need to inspect to have a 90% chance of finding at least one flaws?

44
Exercise In a certain city, medical expenses are given as the reason for 75% of all personal bankruptcies. Calculate the probability that medical expenses will be given as the reason for two of the next three personal bankruptcies filed in that city.

45
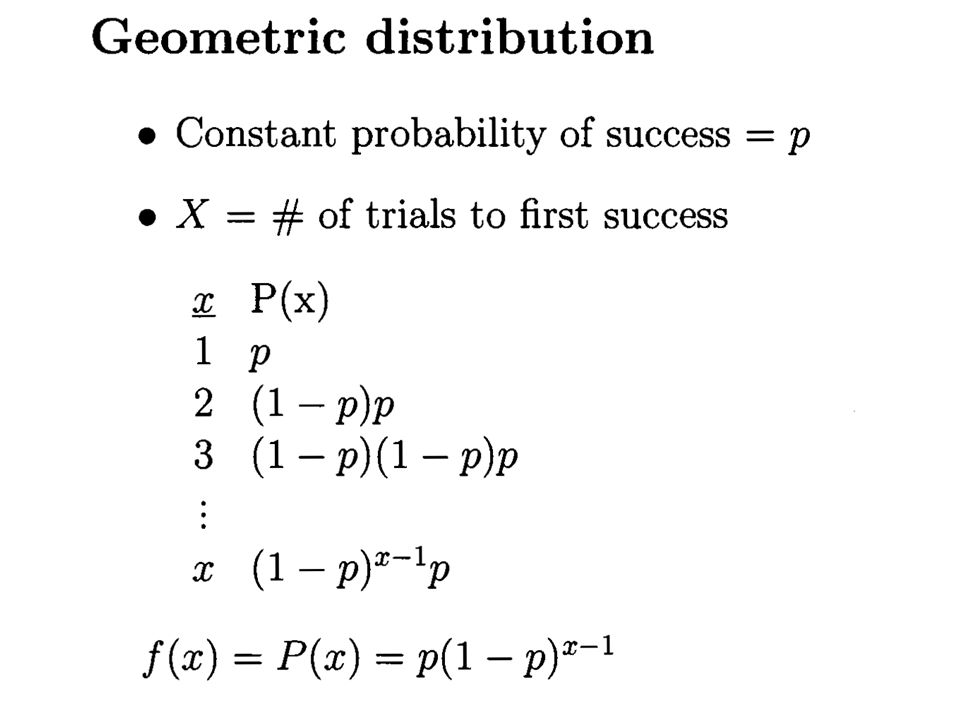
To get a driver’s license, you must first pass a written examination
To get a driver’s license, you must first pass a written examination. If you fail in an exam, you can take it the second time until you pass it. Suppose you fail an exam with probability 0.3, and all the tests are independent. What is the probability that you have to take the test twice in order to pass the written exam? 2) What is the probability that you have to take the test more than 2 times in order to pass the written exam?
 What is the probability that you have to take the test more than 2 times in order to pass the written exam")
Similar presentations


 Chapter 5 Some Important Discrete Probability Distributions.>")


 Chapter 5 Some Important Discrete Probability Distributions.>")


