Download presentation
Presentation is loading. Please wait.

1
Bronx Center to Reduce and Eliminate Ethnic and Racial Health Disparities Impact of Perinatal Health Issues on Infant Mortality and Morbidity in the Bronx Deborah Campbell, MD, FAAP Division of Neonatology June 15, 2007

2
Faculty Disclosure Form In the past 12 months, I have not had any significant financial interest or relationship with the manufacturers of the products or providers of the services that will be discussed in my presentation. This presentation will not include discussion of pharmaceuticals or devices that have not been approved by the FDA.

3
Bronx Health Center and Community Districts

4
Overview Perinatal Health in the Bronx ♦Rates for infant and maternal mortality, low birth weight, teen pregnancy, late or no prenatal care exceed city, state and US averages ♦Large racial disparities for black and Hispanic women and infants

5
Overview of Bronx Perinatal Health ♦Highest IMR are in Morrisania, Williamsbridge and East Tremont sections of the Bronx ♦> 10% infants are born LBW ♦12% of Bronx births are to teen mothers ♦Mott Haven, Hunts Point, East Tremont, Morrisania ♦~ 66% Bronx births are to women on MA – NYS rate is 20% ♦Mott haven, Hunts Point, Unionport/Soundview, Concourse/Highbridge, Fordham, Williamsbridge ♦25% pregnant women have late/no PNC ♦Additional 41% inadequate PNC ♦Fordham, Bronx Park, Central Bronx, Highbridge, Morrisania, Mott Haven and Hunts Point

6
Overview of Bronx Perinatal Health ♦> 50% delivering women in the Bronx are immigrants ♦Primarily from Latin America ♦> 50% Spanish speaking ♦Highest rates of asthma in NYC ♦Breastfeeding rates

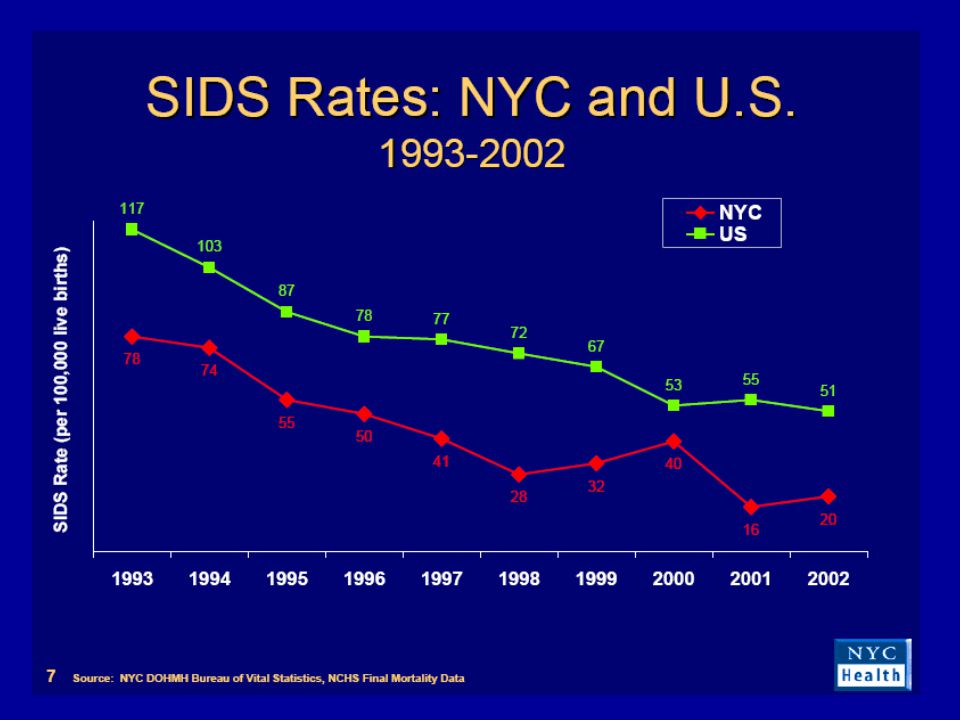
7
Live Births, Induced Terminations and Spontaneous Terminations

8
Live Births, Induced Terminations and Spontaneous Terminations, NYC 1986-2005

9
2005 Live Births, Spontaneous and Induced Terminations of Pregnancy Total Pregnancies43621 Live births20766 Spontaneous terminations2271 Induced terminations20584

10
Live Births, Induced Terminations NYC, 2005

11
Live Births by Maternal Ethnicity

12
Live Births by Race/Ethnicity & Borough 2005

13
Bronx Live Births 2005: 20,766 Bronx Lebanon Hospital CenterLevel IIIC2891 Jack D. Weiler Hosp (Montefiore)IIIC/RPC4572 Jacobi Medical CenterIIIC2238 Lincoln Medical and Mental Health CenterIIIC2421 North Central Bronx HospitalIIB1743 Our Lady of Mercy (2007 – Montefiore N)IIIB1668 St. Barnabas HospitalIIIA1294 Women’s Health and Birthing Center 120 Home 8 Foundling 1 Bronx resident births outside borough3810
IIIC/RPC4572 Jacobi Medical CenterIIIC2238 Lincoln Medical and Mental Health CenterIIIC2421 North Central Bronx HospitalIIB1743 Our Lady of Mercy (2007 – Montefiore N)IIIB1668 St. Barnabas HospitalIIIA1294 Women’s Health and Birthing Center 120 Home 8 Foundling 1 Bronx resident births outside borough3810.")
14
NYC Live Birth Characteristics

15
Distribution of Births By Gestational Age

16
Ancestry of Mother in 2005 ♦NYC - 122,725 LB ♦Puerto Rican9922 ♦Dominican9907 ♦Mexican7986 ♦African-Am.16448 ♦Chinese7426 ♦Jewish/Hebrew7632 ♦Other Hispanic6769 ♦Bronx – 20,766 LB ♦Puerto Rican 1337 ♦Dominican4052 ♦Mexican1754 ♦African-Am.4005 ♦Jamaican745 ♦Other Hispanic1132

18
Teen Childbearing ♦Preliminary data for 2005 ♦Decline in birth rate by 2% to 40.4/1000 women 15-19 yrs. ♦Greatest decline among 15-17 yr olds. to 21.4/1000 ♦Rate for 18-19 yr olds. stable at 69.9/1000 ♦Rate for 10-14 yr olds. unchanged: 0.7/1000 ♦3% decline for non-Hispanic white and non- Hispanic black teens 15-19 yrs old, between 2004- 2005 ♦6% for non-Hispanic black teens 15-17 yrs old

19
Teen Birth Rate for 15-19 year olds: 1991 v. 2005

20
Teen Live Births: 2003-2005 US rate for 2004: 10.3% 2005 rate for 15-19 y/o: 40.4

21
Infant, Neonatal and Post-Neonatal Mortality Rates, NYC 1988-2005

22
Citywide Infant Mortality ♦2005 ♦6.0/1000 LB v. 6.8/1000 LB for the entire US ♦Decline in births by 1.1 % from 2004 ♦Decline in infant mortality by 3.8% ♦Since 1990 there has been a 48% decrease in NYC’s IMR ♦Infant mortality is influenced by multiple factors ♦Maternal health, SES over the perinatal care continuum, substance use, access to and utilization of quality service, levels of stress and social support ♦Knowledge about safe sleep position and other risk factors for SIDS

23
2005 IMR by Borough Brooklyn6.0* Bronx6.3 ( from 7.1 in 2004) Manhattan4.4 Queens5.1 Staten Island5.2
 Manhattan4.4 Queens5.1 Staten Island5.2")
24
Infant Mortality Rate by Borough: NYC, 1994-2004

26
Infant Mortality Rate/1000 LB: Bronx Health Districts 2001-2005 20012002200320042005 Bronx5.96.58.67.16.3 Fordham- Riverdale 5.25.68.25.24.9 Morrisania5.35.98.88.97.4 Mott Haven5.13.57.94.35.8 Pelham Bay4.47.38.79.06.0 Tremont7.06.110.26.57.0 Westchester7.29.67.68.76.4

27
2005 Infant Mortality Rate by Ethnicity

28
Trends in Infant Mortality Rate by Race/Ethnicity: NYC, 1994-2004

29
Distribution of Deaths: Fetal-Neonatal-Infant Mortality 4.52 US: 6.79 2.27 Non-Hispanic Black 13.6 Non-Hispanic white 5.7 Hispanic 5.65

30
Components of Perinatal Period of Risk

31
The Role of Maternal Morbidity and Mortality

32
Maternal Mortality Ratios for White Women:1987-1996 Note: The colors on these maps show the states divided into three terciles based on their MMR.

33
15.9 in NYS 23.1 in NYC 12.9 in NYS A Regional Look at Maternal Mortality Ratios* for the Year 2000 *Per 100,000 live births

34
Findings of the SMI Causes of Death (n=33) August 2003 – June 2005 ♦Embolism24.2% ♦PIH24.2 % ♦Hemorrhage15.2 % ♦Infection15.2 % ♦Cardiomyopathy 6.1 % ♦AnesthesiaNone ♦Other/Unknown15.2 %
 August 2003 – June 2005 ♦Embolism24.2% ♦PIH24.2 % ♦Hemorrhage15.2 % ♦Infection15.2 % ♦Cardiomyopathy 6.1 % ♦AnesthesiaNone ♦Other/Unknown15.2 %")
35
SMI: A Look at Chronic Disease ♦54% of the pregnancy-related deaths had a history of chronic disease ♦Hypertension ♦Cardiac Disease ♦DVT ♦Diabetes ♦Scleroderma ♦Sickle Cell Disease ♦Obesity was the most commonly identified (66%)
")
36
Issues Identified ♦Coordination of Care – coverage and vacations ♦Embolism – prophylaxis or treatment ♦Blood bank – Policy and Procedures ♦EMS protocols & ED process ♦Availability of Diagnostic studies ♦Translation Services ♦Prenatal care – Accessible and Acceptable ♦Medical Care – recognition and transfer policy ♦Consultation issues – willingness and adequacy ♦Grief Counseling for Family and Staff

37
37 Trends in Maternal Mortality Ratio by Race/Ethnicity: NYC OVS, 1993-2004 Source: NYC DOHMH Office of Vital Statistics Standard surveillance

38
New York City Initiative ♦Leadership – Gina Brown, MD ♦Multi-disciplinary Committee on Maternal Mortality ♦Enhanced Surveillance and Case Reviews ♦Bureau of Maternal Infant Reproductive Health

39
BMIRH MMR Enhanced Surveillance Methods Case ascertainment Vital Statistics, Medical Examiner, SPARCS Case Review Medical records, ME reports, maternal death certificates, infant birth certificates Data entry and analysis

40
NYC MMR Review 1998-2000: BMIRH Enhanced Surveillance Year # Cases OVS # Cases BMIRH (enhanced surveillance including OVS ) 19982552 (110%) 19994963 (30%) 20003454 (60%) Total108169 (60%)
 (110%) (30%) (60%) Total (60%)")
41
Location of Death: BMIRH 1998-2000

42
Percent of Live Births and Maternal Deaths By Race/Ethnicity: BMIRH 1998-2000 Live BirthsMaternal Deaths

43
MMR and Race/ Ethnicity BMIRH 1998-2003 19.9 93.2 33.3 19.2

44
US Historical Perspective: Racial Disparities YearMMR WhiteMMR BlackRisk Ratio 1915601.01056.01.76 1930601.01174.01.95 1945172.0445.02.59 195061.0222.03.64 19906.526.74.11 1991-19998.130.03.70 Sources: MMWR 2003; JAMWA 57(3), 2002
, 2002")
45
MMWR 2003:52(No.SS-2)
")
46
MMR by Birth Place BMIRH 1998-2003 50.2 58.1 37.8

47
Comparing Leading Causes of Death (%) Cause International PRMR* National PRMR N=4200** NYC PRMR N=119 EmbolismNegligible20%7% Hypertensive Disorders 12%16%10% Hemorrhage25%17%32% Infection/Sepsis15%13%7% Other Obstructed Labor 8% Unsafe Ab 13% Cardiomyopathy 8% CVA 5.0% Anesthesia 2% Cardiomyopathy 8% Anesthesia 7% *International WHO 1993, JAMWA 2002 **National MMWR 2003 ***NYC BMIRH 1998-2000
 Cause International PRMR* National PRMR N=4200** NYC PRMR N=119 EmbolismNegligible20%7% Hypertensive Disorders 12%16%10% Hemorrhage25%17%32% Infection/Sepsis15%13%7% Other Obstructed Labor 8% Unsafe Ab 13% Cardiomyopathy 8% CVA 5.0% Anesthesia 2% Cardiomyopathy 8% Anesthesia 7% *International WHO 1993, JAMWA 2002 **National MMWR 2003 ***NYC BMIRH")
48
Hemorrhage Related Deaths BMIRH 1998-2000 Black64 % Hispanic 21 % White 8 % Asian/Pacific Isl. 8 % In hospital 97%

49
Obesity: Maternal Mortality Risk From Hemorrhage BMIRH 1998-2000 Obesity NYC Live Births 1998- 2000 (n=373,554; % of total) Maternal Deaths (n=169; % of total) OR [CI] Maternal Hemorrhage Deaths (n=39; % of total) OR [CI] Yes17 24 2.24 [1.5, 3.34] 38 3.88 [1.82, 8.26] No714441 Missing123321
![Obesity: Maternal Mortality Risk From Hemorrhage BMIRH Obesity NYC Live Births (n=373,554; % of total) Maternal Deaths (n=169; % of total) OR [CI] Maternal Hemorrhage Deaths (n=39; % of total) OR [CI] Yes [1.5, 3.34] [1.82, 8.26] No Missing123321](http://images.slideplayer.com/14/4370369/slides/slide_49.jpg "Obesity: Maternal Mortality Risk From Hemorrhage BMIRH Obesity NYC Live Births (n=373,554; % of total) Maternal Deaths (n=169; % of total) OR [CI] Maternal Hemorrhage Deaths (n=39; % of total) OR [CI] Yes [1.5, 3.34] [1.82, 8.26] No Missing123321")
50
Hemorrhage Initiative ♦Hemorrhage alert – Commissioner of Health, NYC ♦Hemorrhage protocols ♦Hemorrhage Poster ♦Unusual collaboration between the NYC DOH, NYS DOH and ACOG

51
What About the Bronx?

52
MMR by Borough BMIRH 1998-2003

54
Predictors of Maternal Mortality and Near Miss Mortality ♦Weiler Hospital – Jan. 95 – June 2001 ♦Cases of MM and NM identified ♦ICD-9 codes ♦QI records ♦ICU logs ♦3 Controls from same delivery day ♦Charts reviewed Collaborators: C. Chazotte, MD D. Goffman, MDJ. Choi, MDR. Madden, PhD E. A. Harrison, MDI. R. Merkatz, MD

55
Maternal Mortality and Near Miss ♦Model containing all recognized risk factors: race, maternal age, obesity, past medical history, prior cesarean, and gravidity ♦ Multiple logistic regression ♦ Black race remained a significant factor -OR 5.0 (CI 1.5-17.0)
")
56
Where Do We Go From Here ♦Preconception Care ♦Medical Conditions ♦Obesity ♦Family planning ♦Maternal age, number of children ♦IVF and multiples ♦Systems Issues ♦SMI, NYC ♦Hemorrhage Initiative

57
Newborn and Infant Care Issues

58
Leading Causes Infant Death: 2004 ♦Congenital malformations (20.1%) ♦Disorders related to short gestation and LBW ♦16.6% deaths in 1 st year life due to preterm birth ♦SIDS (8%) ♦Newborn affected by maternal complications of pregnancy (6.1%) ♦Accidents (unintentional injuries) (3.8%) ♦Newborn affected by complications of placenta, cord and membranes (3.7%)
 ♦Disorders related to short gestation and LBW ♦16.6% deaths in 1 st year life due to preterm birth ♦SIDS (8%) ♦Newborn affected by maternal complications of pregnancy (6.1%) ♦Accidents (unintentional injuries) (3.8%) ♦Newborn affected by complications of placenta, cord and membranes (3.7%)")
60
Normal BW > 2500 g (5.5 lbs) Low BW < 2500 g (5.5 lbs) Very Low BW < 1500 g (3.3 lbs) Extremely LBW < 1000 g (2.2 lbs) Birth Weight Categories
 Low BW < 2500 g (5.5 lbs) Very Low BW < 1500 g (3.3 lbs) Extremely LBW < 1000 g (2.2 lbs) Birth Weight Categories")
61
Infant Mortality Rate for Birth Weight Categories, NYC: 1994-2004 VLBW (< 1500 grams) LBW (1500 - 2499 grams) Normal BW (> 2500 grams)
 LBW ( grams) Normal BW (> 2500 grams)")
63
Martin JA, Hamilton BE, Menacker F, Sutton PD, Mathews T.J. Preliminary births for 2004: Infant and maternal health. Health E-stats. Hyattsville, MD: National Center for Health Statistics. Released November 15, 2005.

64
Central Bronx: LBW and IMR

65
South East Bronx

66
Hunts Point – Mott Haven

67
2005 US Breastfeeding Rate: Ever Breastfed (Annual Summary VS, Pediatrics 2007)
")
73
Bronx Initiative to Improve Perinatal Health ♦Nurse Family Partnership ♦Newborn Home Visiting Program ♦Healthy Women/Healthy Baby Initiative ♦Healthy Teens Initiative ♦Breastfeeding Initiative ♦Bronx Strategic Action Committee ♦Citywide Infant Mortality Case Review Committee ♦Infant Mortality Reduction Initiative funded by the City Council

Similar presentations