Download presentation
Presentation is loading. Please wait.

1
Trends in Preterm Birth, Cesarean Delivery, and Induction of Labor in Indiana Statistics from Live Birth Data 1990-2006

2
Trends in Preterm Birth, Cesarean Delivery, and Induction of Labor in Indiana, 1990-2006 Changes in gestational age distribution, Preterm rates by method delivery by gestational age, race/ethnicity, Cesarean rate by total, primary and repeat, Rate of vaginal births after cesarean, Induction rate stratified by maternal race /ethnicity, age and plurality, Index of occurrence by day of week and time of day stratified by vaginal births, inductions, primary and repeat cesareans.

3
Definitions Term: 39 weeks and 0 days through 42 complete weeks of gestation. Near Term: 37 to 38 weeks gestation. “Late Preterm”: 34 to 36 6/7 weeks gestation Preterm: <37 completed weeks gestation

4
The Prematurity Problem Serious health crisis that costs the United States more than $26 billion annually. Key risk factor for infant death. High risk of serious and sometimes lifelong health problems. Late preterm babies (34-36 weeks gestation) have higher rates of death and disability than full-term babies. Near term infants (born at 37-38 weeks) have increased risk for problems compared to infants born at 39 weeks.
 have higher rates of death and disability than full-term babies. Near term infants (born at weeks) have increased risk for problems compared to infants born at 39 weeks..")
5
Percent Preterm Births Indiana and U.S, 1996-2006 In 2006, the preterm birth rate in Indiana was 13.4 percent compared to 12.8 percent for the U.S. Close to 12,000 babies were born preterm. More than 70 percent were late preterm births

6
Preterm Birth Rates: Indiana, 2003-2006 Average © March of Dimes Foundation, April 2009

7
Percent Distribution of Live Births by Gestational Age: Indiana, 2006 Nationally we are seeing a shift in the distribution of gestational age from 40 weeks towards an earlier gestation of 39 weeks. In Indiana the highest number of births occur at 37-38 weeks gestation (near term) not 40 weeks.
 not 40 weeks..")
8
Percent Change by Gestational Age in Weeks: Indiana 1990-2006 Looking at the change in distribution of gestational age, between 1990-2006, we see a sharp increase in late preterm and near term births with a noticeable decline in births at 40 weeks or more. +63% +38% -54% -46% -20%

9
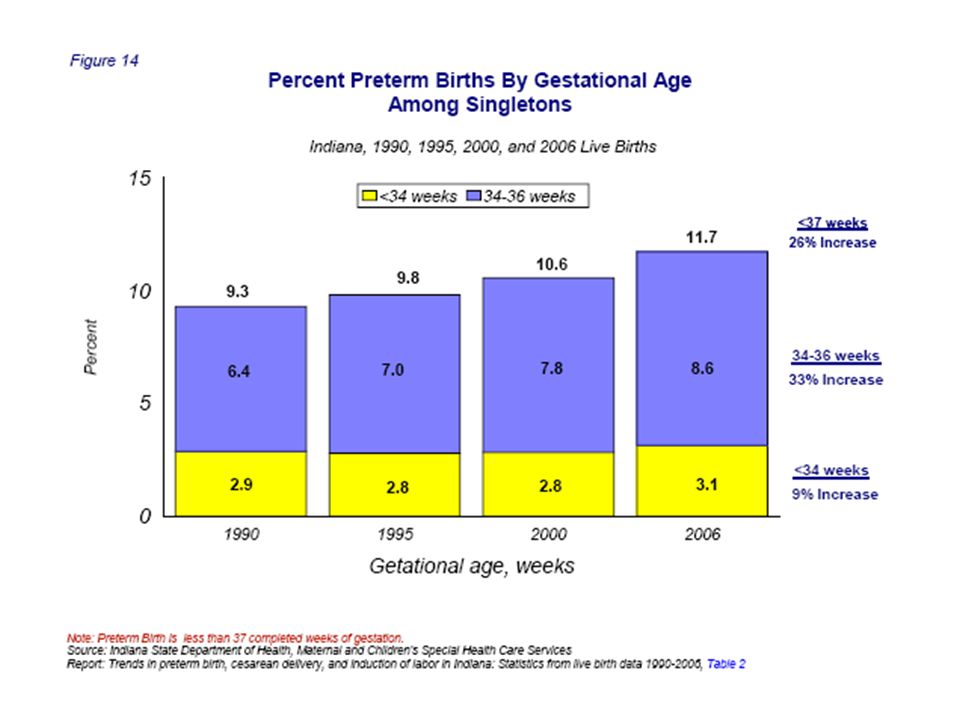
Percent Preterm Births by Gestational Age <37 weeks Early preterm births have remained fairly consistent over time with a slight increase among both 32-33 weeks and < 32 weeks gestation. The preterm rate in Indiana increased by 31 percent from 10.2 in 1990 to 13.4 in 2006

10
Percent of Preterm Births by Race and Hispanic Origin of Mother Preterm rates remain persistently higher among non-Hispanic blacks compared to non- Hispanic whites and Hispanics. A 40% increase in the white preterm rate has shortened the disparity gap not because of less black babies being born preterm but because more white babies are being born preterm.

11
Percent Late Preterm Births (34-36 wks) by Race and Hispanic Origin of Mother Late preterm births increased sharply (by 48%) for non-Hispanic whites and moderately (16%) for Hispanics while there was actually a decrease among non- Hispanic blacks since 2005.
 by Race and Hispanic Origin of Mother Late preterm births increased sharply (by 48%) for non-Hispanic whites and moderately (16%) for Hispanics while there was actually a decrease among non- Hispanic blacks since 2005.")
12
Late Preterm Birth: Indiana, 2003-2006 Average

13
Percent Distribution of Preterm Births by Plurality 15% of preterm births occur among multiples a 33% increase since 1990 85% of preterm births occur among Singleton births. a 26% increase The remainder of this report will report data among singleton births only.

15
Very Preterm: Indiana, 2003-2006 Average © March of Dimes Foundation, April 2009 Very preterm is less than 32 completed weeks gestation. ** Indicates less than five events or missing data. Not able to calculate a reliable rate. Source: National Center for Health Statistics, final natality data. Retrieved October 26, 2009, from www.marchofdimes.com/peristats.

16
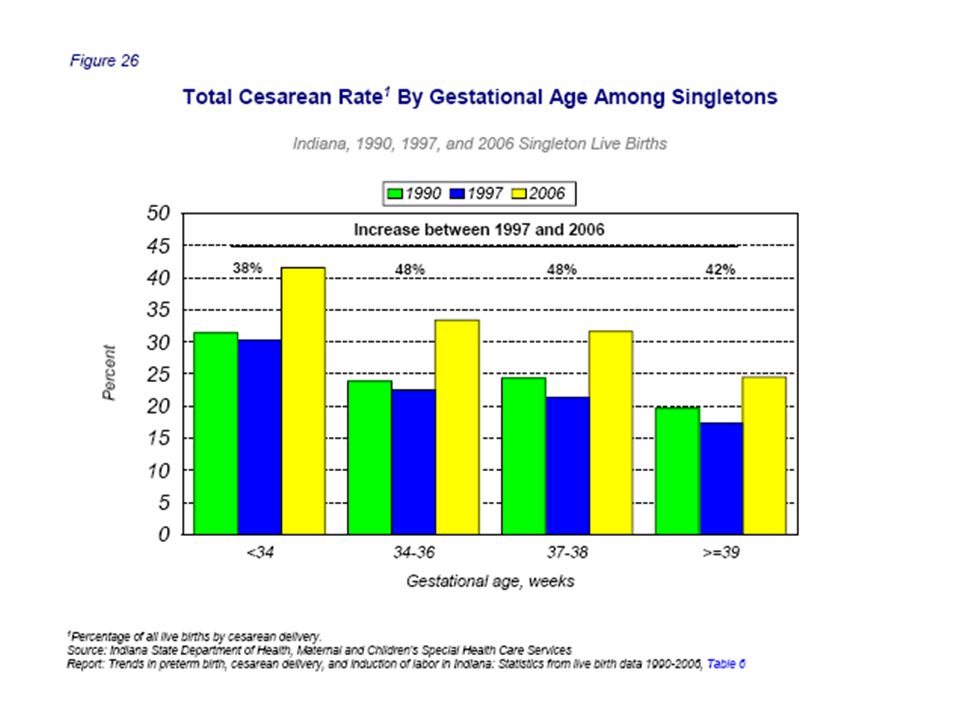
Total Cesarean Rate In 2006, 29.3 percent of Indiana births were delivered by cesarean, a 48% increase from 19.8 percent in 1997.

17
Percent Preterm Births By Method Of Delivery Among Singletons This slide clearly shows the relationship of the increase in cesarean births to an increase in preterm births in Indiana.

18
Percent Preterm Births By Gestational Age And Method Delivery Among Singletons there has been a 41% increase in late preterm births by cesarean section compared to a 27% increase in late preterm births among vaginal deliveries

20
Total and Primary Cesarean Rate and Vaginal Birth After Cesarean Rate The rate of VBAC in Indiana increased from 16.5 percent in 1990 to an all time high or 27.6 percent in 1997, followed by a dramatic decline to 5.8 percent.

21
Primary Cesarean Rate by Age of Mother The 2006 rate for women 35 years of age and older (40.1%) was double the rate for mothers under 20 years of age (22.7%). But The largest increase (66%) in primary cesarean sections occurred in the <20 year old, dooming these young women to a lifetime of repeat cesareans and increase risk of complications.
 in primary cesarean sections occurred in the <20 year old, dooming these young women to a lifetime of repeat cesareans and increase risk of complications..")
22
Primary Cesarean Deliveries: Indiana, 2003-2006 Average © March of Dimes Foundation, April 2009 Over 20.0 (31) 16.9-20.0 (32) Under 16.9 (29)
 (32) Under 16.9 (29)")
24
Total Cesarean Deliveries: Indiana, 2003-2006 Average © March of Dimes Foundation, April 2009 Over 30.3 (30) 26.1-30.3 (35) Under 26.1 (27) Percent of live births Level III OB Hospital Only 7 counties in Indiana have a Level III OB Hospital. The majority of cesarean deliveries are not occurring in these counties. It is imperative that we look more at this and begin to develop a perinatal system in Indiana.

25
Top Ten Hospitals with the Highest Cesarean Rate in 2006 Compared to Indiana State Rate l/l lll/llll/l ll/lll/lll/lll/l 1/1 = Hospital Level of Care

28
ACOG Guidelines on the Induction of Labor “The new criteria for confirming a term pregnancy provides clear and clinically relevant parameters to accurately document when inductions might be considered and cautions against inductions before 39 weeks in the absence of a medical indication,” The guidelines make clear that even mature lung development is not a reason to induce delivery for logistical reasons if the fetus is not at least 39 weeks old, unless it is medically necessary. Risk of having a cesarean section doubles if labor is induced and their cervix is not ready.

34
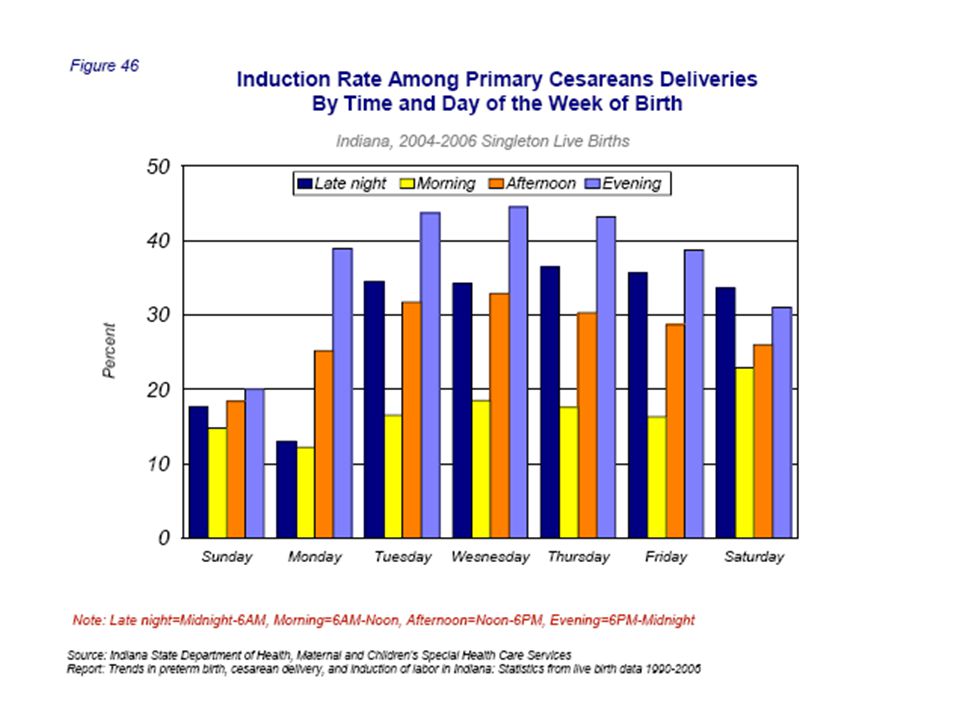
Comparison of Induced Labor Ending In Vaginal Delivery And Cesarean Delivery by Day and Time Inductions in vaginal delivery show a different pattern than inductions resulting in cesarean delivery. Inductions with vaginal deliveries occur most often between noon-6PM on Mondays and Thursdays during the week Inductions with subsequent cesarean occur most often during 6PM – midnight and more often on Mondays and Thursdays.

Similar presentations


 2011 Gestation Birthweight Age of Mother Ethnicity Cause of death Jonnie Dance – Senior Public Health Analyst Teresa.>")


