Download presentation
Presentation is loading. Please wait.

1
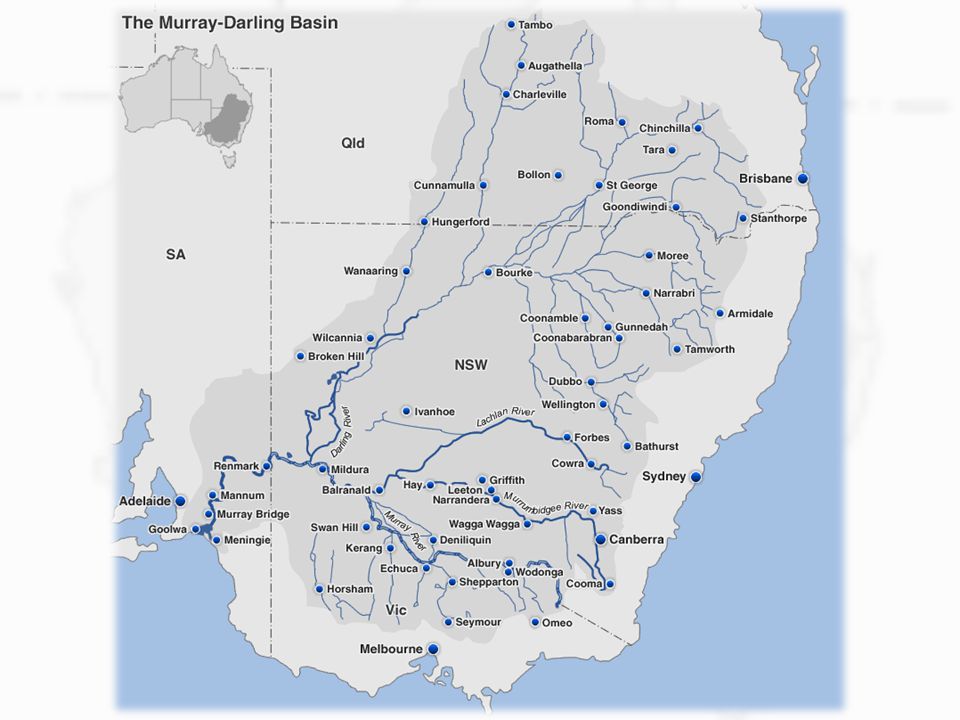
Water use in the Murray Darling Basin

3
Key Knowledge and Skills
Importance of water as a resource in Australia Distribution of water resources Factors affecting water use Factors affecting the pattern of water use

4
Europeans influence Europeans settled in some regions of the MDB in the 19th century, at a time when there had been a series of wet years Make the desert bloom Didn’t have long term rainfall records Ignorant of highly variable climate and river flows

5
Land Use Sheep and cattle were introduced to the region in large numbers Crops requiring large amounts of water were planted The country's growing population had to be fed Export markets needed to be established

6
Clearing ~15 billion trees were cleared to: Establish farms
Supply fuel for the paddle steamers which moved goods from the inland farms to the ports

7
Irrigation The application of water to crops or pasture, especially in dry regions, to supplement rainfall Began in the 1880’s in Mildura Idea from California

8
Human uses Water is required to: Generate power Domestic Industrial
Stock Forestry Mining Recreation Tourism Irrigation, and….

9
Natural uses Water also provides a habitat for: Mammals, Birds
Reptiles Frogs and Freshwater fish. Some of these species are now endangered

10
The Murray river has been described as one of the hardest working rivers in the world, in terms of the amount of water that is taken out of it, and the variety of natural and human needs it supports

11
Important The Basin is Australia’s most important agricultural region
Producing over 1/3 of the country's food supply Providing 39% of the national Income from agricultural production

12
There is a strong spatial association between the basins dry land farming regions and the production of beef cattle, sheep and wheat.

13
There is a strong spatial association between land that is irrigated and the production of dairy products, cotton, rice, fruit and vegetables Irrigation areas Cotton

14
Irrigation Majority of all water used in Australia is consumed in the MDB (52% in 2009) mainly for irrigation Almost 90% of the water is diverted for use The basin contains: 65% of Australia’s total irrigated land 50% of the nations sheep 25% of its cattle

15
Water needed in agricultural production
To produce 1 kg of: wheat = 715 – 750 litres maize = 540 – 30 litres Soybeans = 1650 – 2200 litres Rice = 1550 litres Beef = – litres Wool = litres

16
Agricultural land use in the MDB
See page 49 of your text

17
Water use for agriculture and income generated, Australia wide
What uses the most water? What makes the most money? What has the best return?

18
State and territory shares of the basin and their water use

19
Human and natural uses In the past, the main role allocated to the river was to provide water for human use. Little thought was given to the needs of the river itself An unhealthy river = economical and social impacts & environmental Hume in 2008, Dying river red gum, drying river in NSW

20
Unhealthy river Dying river red gums Declining fish numbers
Algal blooms River not reaching the mouth Drought

21
Environmental Flows Water allocated to the river for a healthy river
This water has to come from somewhere Suggested 4000 gigalitres a year needs to be returned to the river from farm allocations Gigalitre = 1,000,000,000 litres = 1,000 Megalitres = 1 million litres

22
Concerns with Environmental flows
Concerns that returning the water to the river could lead to the decline of small towns Loss of thousands of jobs Loss of hundreds of millions of dollars in economic growth

23
Does water for the environment have any value?
A healthy river can have benefits for regional economies and employment Providing soil moisture for healthy plant life on riverbanks and flood plains Enabling insects to flourish and pollinate crops Replenishing aquifers and stabilising river banks through improved tree cover Trees help keep the water table low, which reduces salinity and improves the level of carbon storage

25
Importance of the MDB 10.9% of Australia's population live within the basin 10 % of all people employed in the basin work in agriculture, compared to 3 % Australia wide 38 % of Australian farmers live in the basin

26
The mean household income for people in the basin in 2006 was $675, compared to $732 for Australia
3% of Australia’s electricity and 33% of the nations hydro electricity is generated in the basin The Gross value of agricultural production (GVAP) in the basin was $15 billion (late 2000) or 39% of Australia’s total value of agricultural products
 in the basin was $15 billion (late 2000) or 39% of Australia’s total value of agricultural products.")
27
52% of Australia’s total water consumption was used by industries (including agriculture) and households in the basin Agriculture uses 83% of water in the basin; households and other industries use 2% each; the water supply industry uses 13%

28
Who uses the water? Water use is unevenly distributed
Biggest regional users on average per year are located in the southern basin: Murray (4338 Gl) Murrumbidge (2257 Gl ) Goulburn – Broken (1071 Gl)
 Murrumbidge (2257 Gl ) Goulburn – Broken (1071 Gl)")
29
Division of water Adelaide receives 42% of its water supply from the Murray and up to 90% in drought years

30
The MDB contains 65% of Australia's irrigated land.
The long term average use of the basins 1.65 million hectares of irrigated land is

31
Movement of water Water is pied to users located outside the MDB in towns like Whyalla, Keith and Woomera in SA

32
Movement In Victoria water is piped from the Goulburn river to Bendigo and Ballarat, and through the North – South pipeline to Melbourne otherwise known as the sugarloaf pipeline See page 54 of text

33
Snowy Mountains Scheme
The snowy mountains scheme diverts water from the snowy river to generate hydro electricity Increases water supplies in the Murray and Murrumbidgee rivers

34
Recreation Boating Fishing Camping Water skiing Golfing
Require clean reliable flows and a healthy river

35
Produce People in Australia and overseas consume agricultural products
Volume of water used for crops and pastures varies from year to year depending on: Volume available for irrigation Trading Commodity prices

36
Discuss answers to questions 1 – 8 as a class Activity 9
Discuss answers to questions 1 – 8 as a class Activity 9. only Agricultural products which produce very high value returns to irrigators should be allowed in the MDB; all other products should be imported or produced elsewhere in Australia

Similar presentations