Download presentation
Presentation is loading. Please wait.

1
Ghent Youth Soccer Project Talent identification Growth and maturation Age effects in soccer

2
Ghent Youth Soccer Project Development of a Multidisciplinary Talent Identification and Training Model in Youth Soccer

3
Purposes GYSP 1.Training model in youth soccer during adolescence: problem of maturation 2.Talent identification: multidisciplinary

4
Multidusciplinary model PsychologicalSociological SOCCER TALENT MorphologicalPhysiologicalTechnical Performance related characteristics

5
Talent identification Detection Identification SelectionDevelopment

6
Sample and design mean age (years) test year 12 1313 1996 199 7 N = 160 141415151616 200 0 199 9 199 8 N = 139 N = 141 N = 128 N = 97 133 96 74 65
 test year N = N = 139 N = 141 N = 128 N =")
7
Sample and design -12-13-14-15-16 mixed-longitudinal 75158173143116 cross-sectionial 82104424968 total number 157262215192184 total number of players tested: 665 total number of observations: 1086

8
PsychologicalSociological SOCCER TALENT MorphologicalPhysiologicalTechnical

9
Height and weight 10 skinfolds Breadth measurements Circumferences Skeletal maturation (TW2) Secundary sexual characteristics (Tanner stages)
 Secundary sexual characteristics (Tanner stages)")
10
PsychologicalSociological SOCCER TALENT MorphologicalPhysiologicalTechnical

11
EUROFIT Aërobic endurance –treadmill Anaërobic endurance and power –Shuttle tempo –Van de Walle test Speed (and agility) –30 m sprint –5x10 m Shuttle sprint Strength –VTJ, CMJ –Isokinetic en isometric (BIODEX)
 –30 m sprint –5x10 m Shuttle sprint Strength –VTJ, CMJ –Isokinetic en isometric (BIODEX)")
12
PsychologicalSociological SOCCER TALENT MorphologicalPhysiologicalTechnical

13
Slalom dribbling test Accuracy of shooting Accuracy of passing (lob) Juggling Competition level: national, provincial, local Field position
 Juggling Competition level: national, provincial, local Field position")
14
PsychologicalSociological SOCCER TALENT MorphologicalPhysiologicalTechnical

15
Sport Interpersonal Relationship Q (Wylleman et al., 2000) Task and Ego Oriëntation in Sport S (Duda, 1989) Intrinsic Motivation Inventory (McAuley et al., 1989) Self Description Q II (Marsh, 1990) Sources of Sport-Confidence Q (Vealey et al., 1998)
 Task and Ego Oriëntation in Sport S (Duda, 1989) Intrinsic Motivation Inventory (McAuley et al., 1989) Self Description Q II (Marsh, 1990) Sources of Sport-Confidence Q (Vealey et al., 1998)")
16
Perceptual skills and decision making

18
1.Do soccer players grow earlier and faster? 2.Soccer players: early or late mature? 3.Physical characteristics in relation to PHV? I. Problem of maturation?

19
Morphological maturation: PHV early mature average mature late mature 1.Do soccer players grow earlier and faster?

20
age cm/year example: Height

21
age cm/year mean age at peak velocity example: Height

22
Height and weight height weight APHV = 13.8 years

23
Question 1: Do soccer players grow earlier and faster than their peers? Answer 1: earlier: probably faster: NO !

24
CL=12.0 jaar SL=9.0 jaar Height=143.1 cm CL=12.6 jaar SL=13.5 jaar Height=165.0 cm 2. Soccer players: early or late mature?

25
10.5 jaar17.5 jaar

26
National level ?

27
Provincial level ?

28
Local level ?

29
Question 2: Soccer players: early or late mature? Answer 2: on average early mature

30
3. Physical characteristics in relation to PHV?

31
age cm/year example: Standing Broad Jump

32
age cm/year mean age at peak velocity example: Standing Broad Jump

33
Explosive strength SBJ VTJ

34
Speed SHRSSPRINT 30m SPRINT

35
Aërobic and anaërobic endurance ESHR STEMPO

36
Flexibility SAR

37
3. Physical characteristics in relation to PHV? Aërobic and anaërobic endurance Strength and SpeedFlexibility

38
II. Talent identification: multidisciplinary Detection Identification SelectionDevelopment

39
Aërobic endurance VariableAgeNationalProvincialLocalDiference ESHR (min)-127.9 ± 0.98.0 ± 0.77.2 ± 1.3n.s. -138.6 ± 1.58.1 ± 1.67.7 ± 1.4N><G -149.6 ± 1.49.2 ± 1.08.2 ± 1.4N,P><G -1510.7 ± 1.29.5 ± 1.48.7 ± 1.6N> <G -1610.9 ± 1.510.3 ± 2.18.9 ± 1.7N,P><G

40
Aërobic endurance: VO 2 max VariableAgeNationalProvincialLocalDiference VO 2 max-1255.9 ± 7.060.2 ± 4.853.9 ± 5.8P><G (ml/kg/min)-1357.0 ± 4.657.2 ± 6.853.1 ± 4.6N,P><G -1457.3 ± 5.756.8 ± 4.353.2 ± 4.9N,P><G -1559.5 ± 4.956.5 ± 4.053.4 ± 6.3N,P><G -1657.4 ± 4.656.1 ± 4.254.7 ± 3.3N><G
 ± ± ± 4.6N,P><G ± ± ± 4.9N,P><G ± ± ± 6.3N,P><G ± ± ± 3.3N><G")
41
Anaërobic endurance: Shuttle Tempo VariableAgeNationalProvincialLocalDiference STEMPO-1277.4 ± 4.872.3 ± 2.480.1 ± 5.4P><G (sec)-1375.1 ± 4.476.0 ± 5.778.0 ± 4.6N><G -1472.4 ± 3.674.4 ± 4.476.4 ± 5.4N><G -1570.1 ± 4.073.0 ± 6.074.8 ± 6.0N><G -1667.6 ± 3.769.3 ± 3.672.1 ± 4.6N><G
 ± ± ± 4.6N><G ± ± ± 5.4N><G ± ± ± 6.0N><G ± ± ± 4.6N><G")
42
Speed VariableAgeNationalProvincialLocalDifference 30 m (sec)-124.5 ± 0.24.5 ± 0.34.8 ± 0.3N,P><G -134.4 ± 0.24.5 ± 0.24.6 ± 0.2N><P,G -144.3 ± 0.2 4.6 ± 0.3N,P><G -154.1 ± 0.24.2 ± 0.24.4 ± 0.3N,P><G -163.9 ± 0.24.0 ± 0.24.1 ± 0.2N><G
 ± ± ± 0.3N,P><G ± ± ± 0.2N><P,G ± ± 0.3N,P><G ± ± ± 0.3N,P><G ± ± ± 0.2N><G")
43
Speed VariableAgeNationalProvincialLocalDifference SSPRINT-1214.5 ± 0.515.0 ± 0.815.5 ± 0.9N><G 5 x 10 m-1314.5 ± 0.815.3 ± 0.815.1 ± 0.6N><P,G (sec)-1414.3 ± 1.114.9 ± 0.9 N><P,G -1513.9 ± 0.714.6 ± 1.014.4 ± 1.0N><G -1613.6 ± 0.914.1 ± 0.814.1 ± 0.6N><P
 ± ± 0.9 N><P,G ± ± ± 1.0N><G ± ± ± 0.6N><P")
44
Strength VariableAgeNationalProvincialLocalDifference VTJ (m)-1232.4 ± 4.534.1 ± 5.330.0 ± 5.0ns -1333.7 ± 4.832.9 ± 5.130.6 ± 4.4N><G -1437.0 ± 5.137.0 ± 4.434.3 ± 5.4N,P><G -1540.4 ± 4.740.0 ± 5.335.7 ± 5.7N,P><G -1644.8 ± 5.045.5 ± 5.840.0 ± 6.5N,P><G
 ± ± ± 5.0ns ± ± ± 4.4N><G ± ± ± 5.4N,P><G ± ± ± 5.7N,P><G ± ± ± 6.5N,P><G")
45
Flexibility VariableAgeNationalProvincialLocalDifference SAR (cm)-1219.3 ± 5.417.6 ± 5.319.0 ± 5.5n.s. -1319.1 ± 6.118.3 ± 6.718.6 ± 5.0n.s. -1420.4 ± 6.118.0 ± 6.918.1 ± 6.2n.s. -1521.9 ± 7.317.3 ± 8.317.3 ± 6.3N><P,G -1622.8 ± 6.919.8 ± 8.215.5 ± 7.8N><G

46
Slalom dribble VariableAgeNationalProvincialLocalDifference Dribbling-1219.2 ± 1.619.0 ± 1.420.8 ± 2.1N><G (sec)-1318.1 ± 1.518.8 ± 2.219.5 ± 1.9N><G -1417.4 ± 1.617.8 ± 1.119.3 ± 2.4N,P><G -1517.2 ± 1.317.4 ± 1.219.2 ± 2.2N,P><G -1616.5 ± 1.317.4 ± 0.817.5 ± 1.1N,P><G
 ± ± ± 1.9N><G ± ± ± 2.4N,P><G ± ± ± 2.2N,P><G ± ± ± 1.1N,P><G")
47
Anthropometry VariableAgeNationalProvincialLocalDifference Height (cm)-12147.7 ± 6.8148.4 ± 6.3145.9 ± 6.7n.s. -13151.8 ± 6.4152.1 ± 6.0153.6 ± 7.4n.s. -14158.2 ± 9.3160.4 ± 7.6159.8 ± 8.8n.s. -15167.0 ± 9.2168.9 ± 7.1167.4 ± 8.8n.s. -16172.0 ± 7.4174.5 ± 8.5174.1 ± 7.7n.s.

48
P10P25P50P75P90 Height (cm)161.3167.0173.1177.7182.2 Weight (kg)47.752.957.764.770.9 Sum 5 skinfolds (mm)17.526.131.239.647.7 Example: Duarte, age -16 Sit and Reach (cm)10.015.920.526.031.0 10 x 5 m SHR (sec)21.319.918.917.917.4 Endurance SHR (min)6.58.09.511.012.0 Dribbling (sec)19.218.016.915.915.4
 Weight (kg) Sum 5 skinfolds (mm) Example: Duarte, age -16 Sit and Reach (cm) x 5 m SHR (sec) Endurance SHR (min) Dribbling (sec)")
49
www.bvlo.be

50
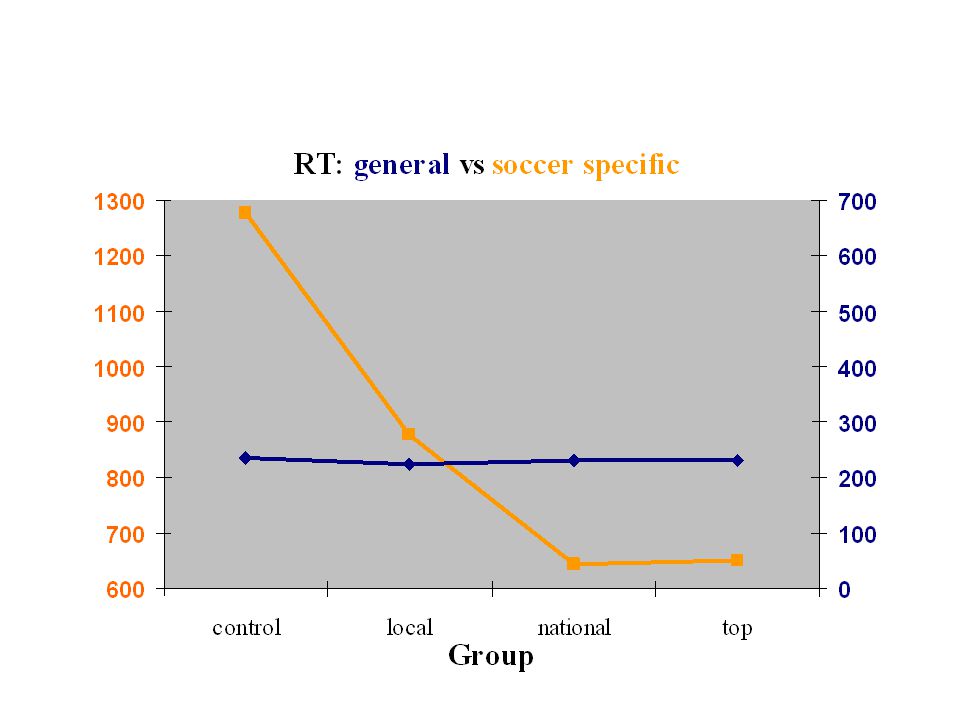
The effects of task constraints on visual search behaviour and decision-making skill in youth soccer players Roel Vaeyens, Matthieu Lenoir, Mark Williams, Liesbeth Mazyn & Renaat Philippaerts (Journal of Sport and Exercise Psychology, 2005, submitted)
")
51
Test tactical skills Universal: film clips of simulated soccer actions lab: projection on life-size screen Decision taking: open offensive situations 2 vs 1 3 vs 1 3 vs 2 4 vs 3 5 vs 3

56
Mean number fixations/sec per group and situation

57
Mean fixation duration per group and situation

58
Fixation location: 3 vs 1

59
Fixation location: 5 vs 3

60
II. Talent identification: multidisciplinary Detection Identification SelectionDevelopment

61
Selection of younger players in 1 st team? The Belgian case Evaluation of the ‘under-21 rule’ Do young adult (U-21) soccer players benefit? Roel Vaeyens – Renaat Philippaerts Ghent University Dept. Movement and Sports Sciences
 soccer players benefit. Roel Vaeyens – Renaat Philippaerts Ghent University Dept. Movement and Sports Sciences.")
62
Methods Official match data from Royal Belgian Football Association 2e national (D2) + 3e national A (D3) 4 seasons –1998-1999 –1999-2000 –2000-2001 –2001-2002 53 teams – 2138 players
 + 3e national A (D3) 4 seasons – – – – teams – 2138 players")
63
Team selections conform -21 rule (%)
")
64
Means (± SD) of number of selections and playing minutes per player and per season (D2) Season Age group 98-9999-0000-0101-02 Selections U21 13.6 ± 10.512.5 ± 10.413.0 ± 10.912.8 ± 11.0 21+ 23.1 ± 9.622.6 ± 10.522.7 ± 9.323.1 ± 9.5 Minutes U21 732.2 ± 840.1605.6 ± 804.0672.4 ± 830.6620.5 ± 845.9 21+ 1637.4 ± 942.21646.9 ± 1019.21625.6 ± 908.61669.0 ± 923.0
 of number of selections and playing minutes per player and per season (D2) Season Age group Selections U ± ± ± ± ± ± ± ± 9.5 Minutes U ± ± ± ± ± ± ± ± 923.0")
65
Conclusions Teams in conformity with the U-21 rule Rather large variation within and between teams No increase in playing opportunities for young adult players in 1 st team Solutions: –change in mentality of trainers-coaches, clubs –better youth education programme

Similar presentations