Download presentation
Presentation is loading. Please wait.

1
History Dynatest was founded in 1976 in Denmark by a group of engineers and technicians who combined science technology and business into the development and manufacturing of highly specialized equipment and methodology for pavement engineering. The first product, the Falling Weight Deflectometer (FWD) was introduced the same year and has since then become a product acknowledged as the market leader in quality and reliability.
 was introduced the same year and has since then become a product acknowledged as the market leader in quality and reliability..")
2
Providing pavement testing and evaluation equipment and services. Offices around the world provide equipment and consulting services including: 1. Falling Weight Deflectometers 2. Friction Testers 3. Road/Runway Surface Profilometers® 4. Automated Condition Surveys using the Dynatest Multi Function Vehicle (MFV) 5. Manual condition surveys 6. Pavement Management Systems, designed for use on airports and highways worldwide. Consulting Services
 5. Manual condition surveys 6. Pavement Management Systems, designed for use on airports and highways worldwide. Consulting Services.")
3
Dynatest Equipment Products Light Weight Deflectometer (LWD) Falling Weight Deflectometer (FWD) Heavy Weight Deflectometer (HWD) Truck Mounted Deflectometer (TMD) Road Surface Profilometer (RSP) Portable Road Surface Profilometer Tire Traction Tester (TTT) Pavement Friction Tester (PFT) Runway Friction Tester (RFT) Heavy Vehicle Simulator (HVS)
 Falling Weight Deflectometer (FWD) Heavy Weight Deflectometer (HWD) Truck Mounted Deflectometer (TMD) Road Surface Profilometer (RSP) Portable Road Surface Profilometer Tire Traction Tester (TTT) Pavement Friction Tester (PFT) Runway Friction Tester (RFT) Heavy Vehicle Simulator (HVS)")
4
RSP Components Laptop computer mounted on a pedestal

5
RSP Components Transducer Beam and brackets Mark IV Mark III

6
RSP Components The photo sensor is triggered by reflective tape or reflective cone to start and/or stop the data collection at a specific place, or for automated event marking.

7
Mark III Component Detail

8
Mark III Component Detail-Inside the vehicle

9
Mark III-Inside the DPU

10
Mark III Component Detail - Wheel Mounted Encoder

11
Mark IV Component Detail EPU (Electronics Processing Unit)
")
12
Mark IV Component Detail Laser and accelerometer inside adjustable arms

13
Mark IV Component Detail - Wheel Mounted Encoder

14
Theory of operation The RSP is an Inertial Profiler. It utilizes three components to make it work: A reference elevation - accelerometer A height relative to the reference – laser sensor Longitudinal distance – wheel encoder

15
Items needed to measure profile Height Sensor

16
Items needed to measure profile Accelerometer

17
Items needed to measure profile Distance Encoder

18
Profile A profile is a two dimensional slice of the road, taken along an imaginary line.

19
Laser and Accelerometer Sampling

20
Intervals Sample Interval - Longitudinal distance between computed values Recording Interval - Longitudinal distance between stored values Reporting Interval – Segment length for reporting a roughness index

21
Storage or Reporting Interval

22
Sampling and Reporting Interval The discrete measurements from the sensors are captured and averaged over each inch of travel. These ‘one inch intervals’ are the basis of all indices regardless of the reporting interval. For example: If longitudinal profile is reported every 12 inches, then it is the average of 12 ‘one inch intervals’. Faulting is based on ‘one inch average elevations’. Rutting is computed every 4 inches of travel. The laser elevations used for this are the averages of four ‘one inch average elevations’. If rutting is reported every 12 inches, then it is the average of three such rutting computations.

23
International Roughness Index (IRI) It is accumulated suspension travel over a given distance. Usually expressed as in/mi or m/km. The model is based on the “quarter car” simulation. It is reproducible, stable over time, and works with different types of profiling devices. It is a general pavement condition indicator.

24
International Roughness Index (IRI) The IRI formula is the same for all profilers. It is the most widely used general purpose roughness index. IRI Scale

25
IRI Notes Profile smoothed with a moving average of 250 meter base length Profile filtered again using ¼ car simulation The ¼ car simulation assumes 80 km/h Imagine you are sitting in a “strange” one-wheel vehicle with a single seat…the IRI is the roughness you feel. That is… the ups and downs coming from waves in the range of approximately 3 to 100 feet. HRI – Half-car index Left Profile + Right Profile divided by 2

26
Filtering Profile data must be filtered to become useful. Filters are used to remove unwanted information. A high pass filter removes pavement geometrics. A low pass filter removes point to point fluctuations and smooths the profile.

27
Can the Filter Settings Affect IRI & HRI? There is virtually no difference in IRI or HRI when comparing a run using a 200 Ft. filter vs. using 300 Ft. Filtering at less than 200 ft (such as using a 100 Ft. filter) could possibly affect the IRI since some wavelengths which are critical to IRI can occur at lengths greater than 100 Ft. Some states use a 200 Ft. filter while some use 300 filter. The reasons for using a 300 Ft Filter is related to the simulation of profilograph index, not measurement of IRI.
 could possibly affect the IRI since some wavelengths which are critical to IRI can occur at lengths greater than 100 Ft. Some states use a 200 Ft. filter while some use 300 filter. The reasons for using a 300 Ft Filter is related to the simulation of profilograph index, not measurement of IRI..")
28
Can the Filter Setting Affect Profile? 1 run with 300 Ft Filter 10 runs with 200 Ft Filter

29
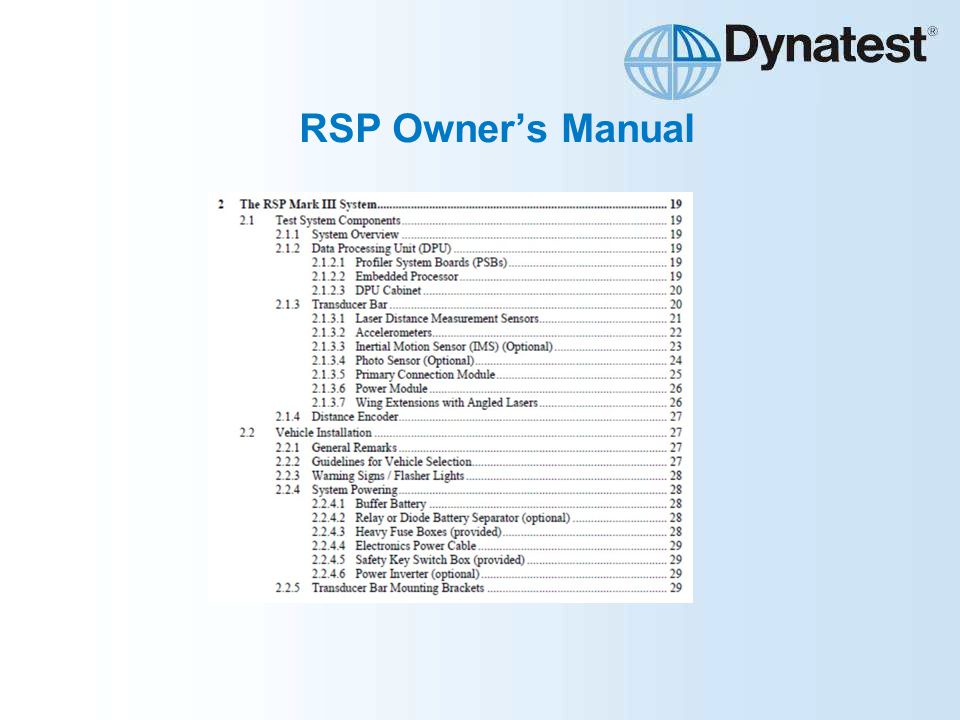
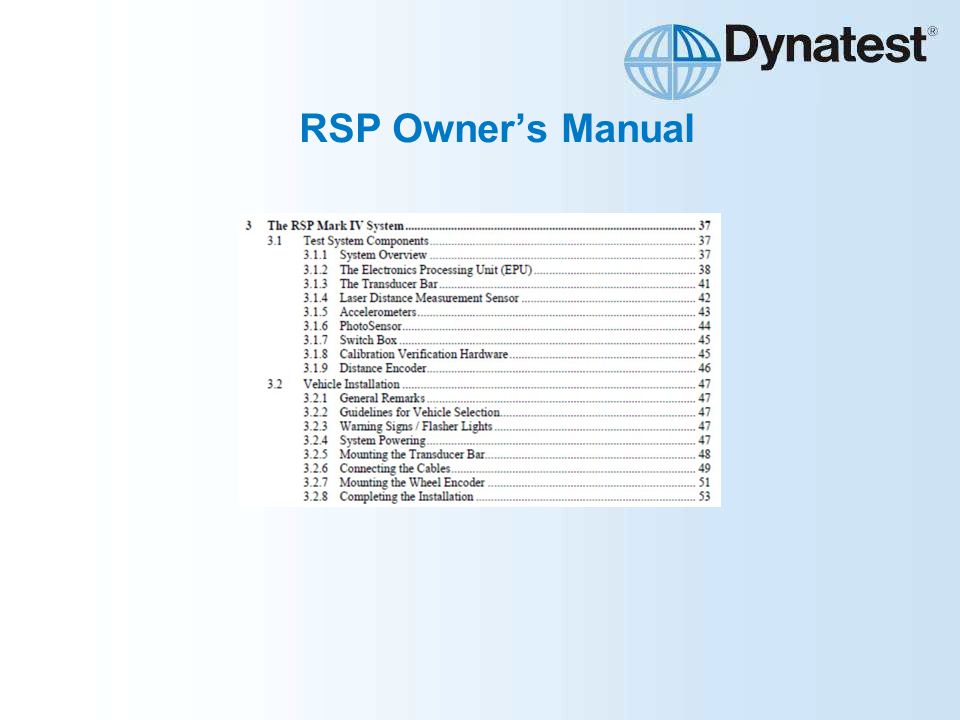
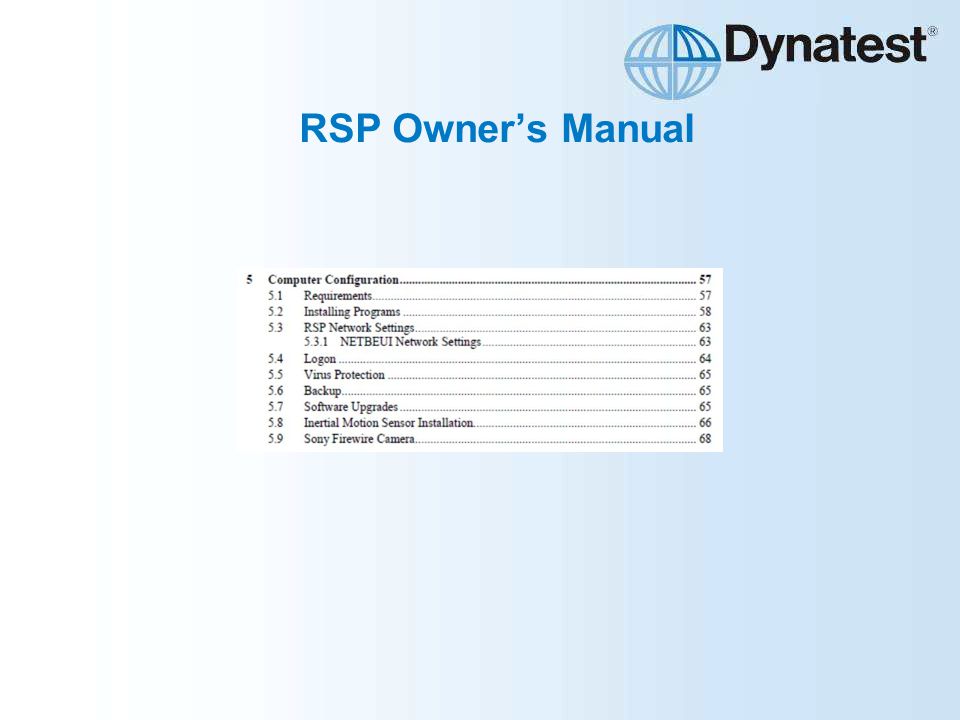
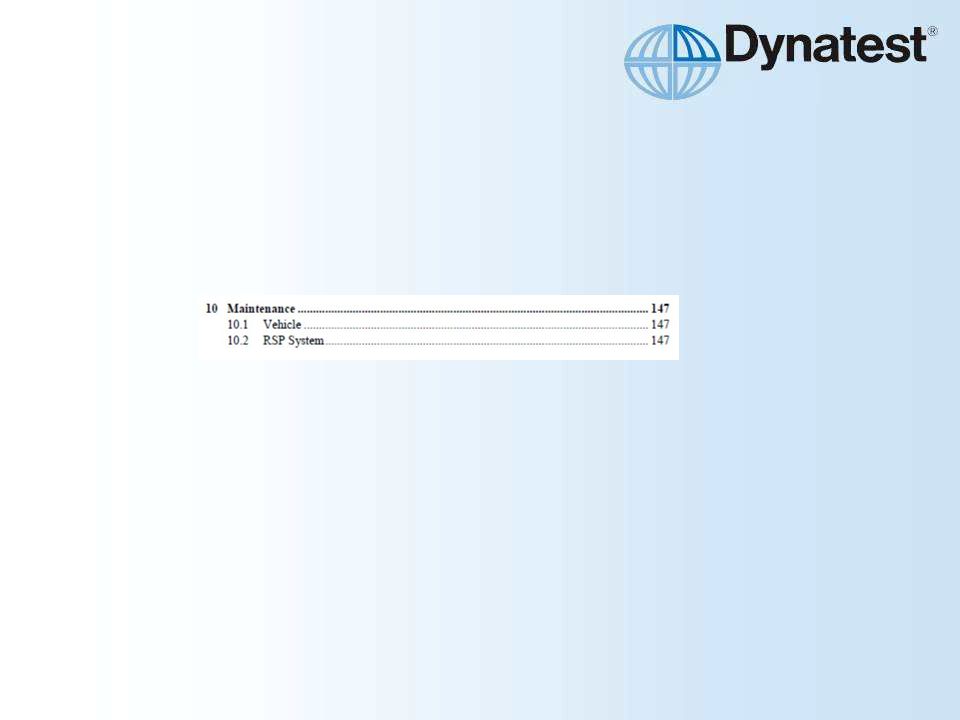
RSP Owner’s Manual

43
Operational Checks Daily Checks Before Leaving Base: Laser block check Bounce test Check vehicle tire pressure Distance measurement check Viewing the data collection screen

44
Operational Checks - Laser Block Check The Electronics screen displays both the distance of the laser to the pavement surface and the elevation of the block in relation to the base plate. Once the base plate is placed under the laser, click the reset laser readings box to set the base plate reading at 0. This references subsequent block measurements to the elevation of base plate surface.

45
Operational Checks - Bounce Test To Perform a Bounce Test: Place the program in “Bounce” mode Make sure that the vehicle is stationary Place a flat smooth, non-glossy plate under each laser. Bounce the vehicle up and down by stepping on the front of the vehicle. If the bouncing is strictly vertical, the accelerometers shall compensate for the movement of the laser sensors, leaving the profile traces shown in the Strip Chart window virtually flat during the bouncing. The Blue and Red traces represent the lasers and accelerometers. The red, black and green traces are the resulting profiles with scaling of one inch

46
Operational Checks - Distance Measurement Check The check can be performed using a “Stop-Go-Stop” method, or “On-The- Fly” using the photocell.

47
Operational Checks – Viewing the Data Collection Screen

48
Data Collection Notes The lead in period should be at least 1.5 times the length of the filter length. 300 or 200 feet is the generally accepted filter length You can collect a series of profile elevations at 15, 20, 25, and 35 mph and so on, and the profile elevations recorded will be the same regardless of data collection speed so long as the 15 mph lower speed limit is respected. The math equations used to calculate profile elevation data are largely dependent on the accelerometers - 85% vs 15% for the lasers. You can check this by closing the laser cover and running a profile with just the accelerometers functioning. You can then rerun the section with the lasers uncovered and compare profiles. They will be different, but not by much.

49
Stop & Go and IRI Values

Similar presentations


 Chapter 2 Surface Characteristics.>")

 for Construction Acceptance Technical Standards Branch Knowledge Presentations to the CEA February 13 th, 2014 Jim.>")


 Know four critical components of the traffic system Know there is considerable.>")

>")