Download presentation
Presentation is loading. Please wait.

1
ENDOR Electron Nuclear Double Resonance Professor P. T. Manoharan Department of Chemistry and RSIC Indian Institute of Technology Madras Chennai - 600 036, India

2
G. Feher (1956) Phys. Rev. 103, 834 It complements the technique of EPR in identifying the nuclei that are weakly interacting and allows the detailed mapping of the electron wave function. EPR Hamiltonian H = B.g.S + S. D.S + I i.. A i. S + I i. P. I i + n B.g n.I i i i i

3
ENDOR 1 Solves the ambiguity in the assignment of hyperfine multiplets (i.e., correct identification of the nucleus) 2 Resolves the hyperfine lines, not resolved in EPR due to line broadening or complexity. 3 Gets more accurate values (PRECISION) for hyperfine coupling. 4 Measures nuclear quadrupole coupling constants (when I 1) Advantages: Sharper EPR lines/precise determination of hfc constants. Two Related Techniques ENDOR is EPR detected NMR ENDOR Two frequencies irradiate the sample, a constant MW and a swept RF either by CW or pulsed mode ESEEM Pulsed method irradiate the sample only by MW pulses.
 for hyperfine coupling. 4 Measures nuclear quadrupole coupling constants (when I 1) Advantages: Sharper EPR lines/precise determination of hfc constants. Two Related Techniques ENDOR is EPR detected NMR ENDOR Two frequencies irradiate the sample, a constant MW and a swept RF either by CW or pulsed mode ESEEM Pulsed method irradiate the sample only by MW pulses..")
7
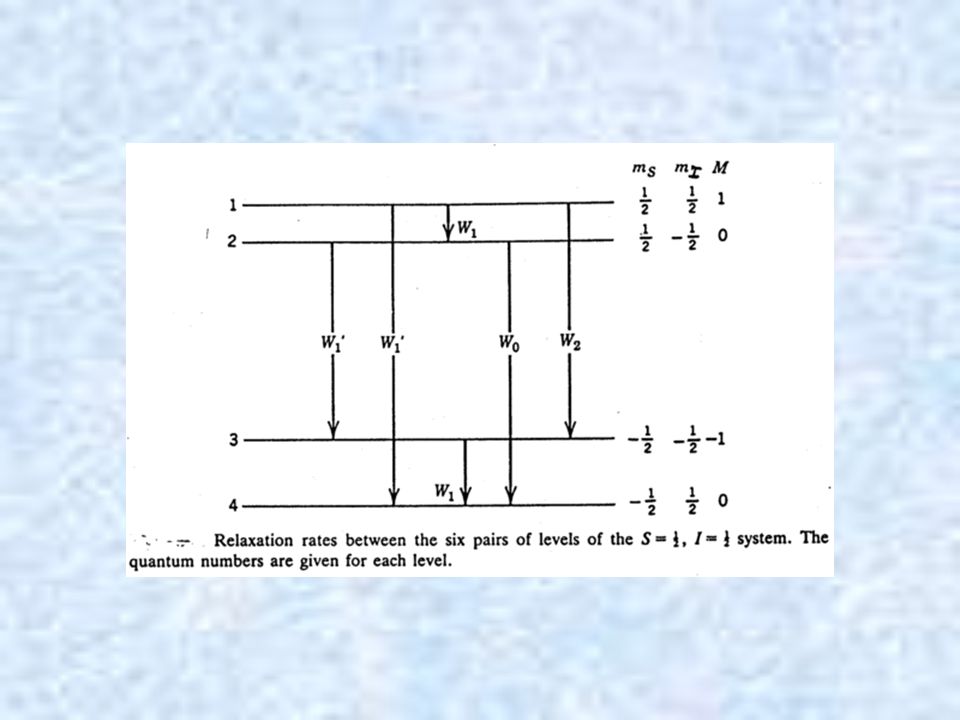
S =, I = Case. Isotropic spin Hamiltonian H = g b B Sz - gn b B Iz + A S. I E = g b B ms – gn b B mI + A ms mI Transition probability is given by W if | | 2 Let us say that the first EPR transition occurs at a field of B k and second one at B m, |B k B m | being the hyperfine coupling constant A/h and the centre of B k and B m defining the g value of the system.

8
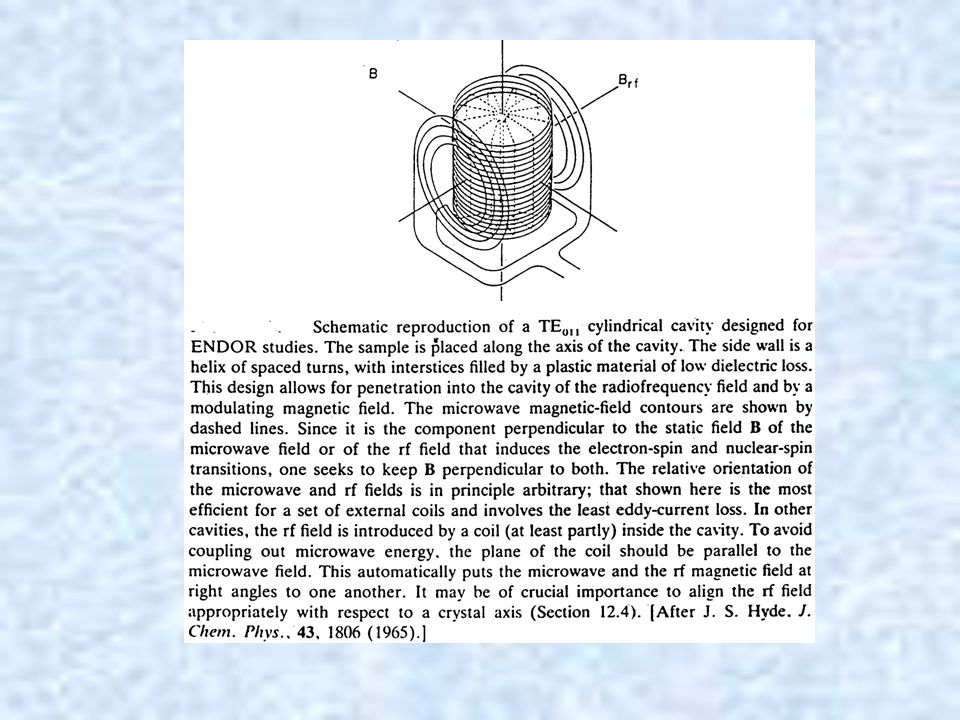
CW ENDOR 1 The sample placed in a microwave cavity is subjected to a low microwave power and the magnetic field is placed at B k. Optimize the parameter to get maximum amplitude of this signal 2 Achieve Partial saturation by increasing the microwave power (B 1e ) several fold. 3 Now the sample is subjected to rf magnetic field (B 1n ) of wide range and large power out put from an rf generator. rf-frequency range will depend on Bk i.e microwave frequency and also the n of the concerned nucleus. [In the case of proton the range is 2 to 30 MHz since proton NMR frequency corresponds to n = gn b Bk / h ] The base line indicative of a constant EPR absorption (horizontal axis is that of n from rf generator) will have two absorptions at n 1 and n 2
 several fold. 3 Now the sample is subjected to rf magnetic field (B 1n ) of wide range and large power out put from an rf generator. rf-frequency range will depend on Bk i.e microwave frequency and also the n of the concerned nucleus. [In the case of proton the range is 2 to 30 MHz since proton NMR frequency corresponds to n = gn b Bk / h ] The base line indicative of a constant EPR absorption (horizontal axis is that of n from rf generator) will have two absorptions at n 1 and n 2.")
10
± ?

11
( n1 ± n2 ) = n = g n n B k /h NMR frequency of the nucleide (bare) responsible for the hfc. Also n2 n1 = A/h. Upper sign | A | > 2 n Lower sign | A | < 2 n IMPLIES Identification of the nucleus (g n with in 0.1% accuracy) Precise hfcc. Extremely low linewidth Repeat the experiment at B m to get another ENDOR spectrum. This plot of rf frequency of changes in the EPR absorption intensity is called the ENDOR experiment
 Precise hfcc. Extremely low linewidth Repeat the experiment at B m to get another ENDOR spectrum. This plot of rf frequency of changes in the EPR absorption intensity is called the ENDOR experiment.")
13
NOTE 1. The relative intensities of the two lines may not be same with the two ENDOR spectra. Sometimes, one line may not even be detected, specially when |A| = 2 n. 2. ENDOR line typically represents a change with the EPR line intensity of 1% of EPR line under non saturated conditions; hence a spectrometer of high sensitivity is needed 3. Partial saturation is sufficient for the EPR; mostly saturations are accomplished at ~ 4K. More complete saturation is needed for the NMR transition. 4. ENDOR lines are relatively much narrower than EPR lines: ENDOR 3kH z to 1 MH z EPR 0.1mT 2.80 MH z Hence, the accuracy of splittings 10 -3 % 5. Number of lines in an ENDOR spectrum is considerably less, i.e., greater effective resolution and easier interpretation 6. Anisotropic hfc can be determined in solids by angular dependent ENDOR 7. For I > one can determine e 2 qQ 8. Signs of A and e 2 qQ can also determined

14
(eg) diphenylanthracene (DPA) negative ion All lines in this spectrum correspond to A/h < n hfc s are 0.6MH z, 4MH z and 7MH z.
 diphenylanthracene (DPA) negative ion All lines in this spectrum correspond to A/h < n hfc s are 0.6MH z, 4MH z and 7MH z.")
15
ENDOR experiment determines NMR transitions much better than an ordinary NMR experiment because of far greater ENDOR sensitivity due to: 1 EPR quantum >> NMR quantum (population differences higher) 2. d E /dt is high at MW frequencies. 3. Effect of static field + Electron field helps alter the intensity of EPR line during ENDOR (Enhancement )
.")
16
Dynamics of ENDOR Rearrangement of level populations from thermal equilibrium ( = g B/kT) i. Boltzmann Population on the application of B. ii. By pumping MW power on top of the EPR line; (ii) Turning on the RF pump power; (iii) Tracing out the ENDOR response on a recorder
 Turning on the RF pump power; (iii) Tracing out the ENDOR response on a recorder.")
19
± ?

20
Quadrupole Coupling Constant (QCC) For spin I 1, consider the quadrupole interaction terms. Due to the additional relaxation paths, more difficult to predict the intensity of the ENDOR lines. In liquids isotropic hyperfine coupling In solids, powders, frozen solution anisotropic information including QCC.

21
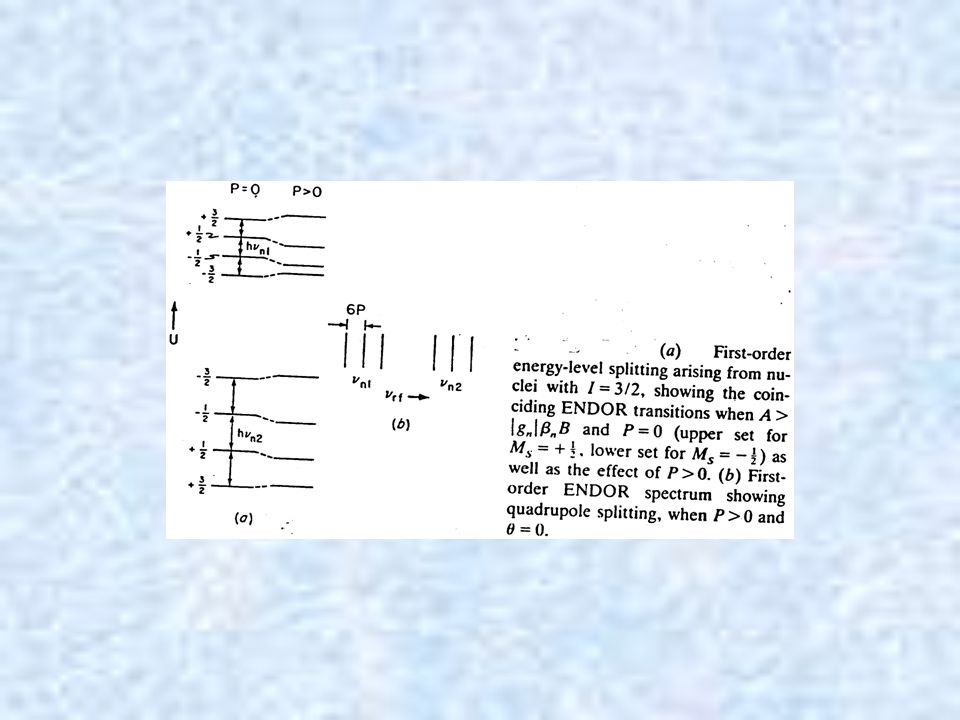
Applications F Centre in alkali Halides. Anion vacancy in KBr. EPR line width 12.5 mT i.e., 125G due to a large number of unresolved lines. First shell and all other odd number shells have 39 K (93.26%) or 41 K(6.73%) Even numbered shells 79 Br(50.69%) and 81 Br(49.31%) Six First shell and twelve 2 nd neighbour shell nuclei give j (2n j I + 1) = 19x37 = 703 epr lines. ENDOR will be spread over a considerable range of frequency. Anisotropic and isotropic interactions will fall off with distance All are of I = 3/2 i.e., hfcc + Qcc + differing n Hence EPR give no indication of any structure. ENDOR 0.5 to 26 MH z Narrowest line 10KH z Quadrupolar contribution added n1 = |1/2[A || + A (3cos 2 - 1)] - g n n B + 3P(3cos 2 - 1) (M I - )|/h n2 = | - [A || + A (3cos 2 - 1)] - g n n B + 3P(3cos 2 - 1) (M I - )|/h Where P = e 2 qQ/4I(2I 1)
 or 41 K(6.73%) Even numbered shells 79 Br(50.69%) and 81 Br(49.31%) Six First shell and twelve 2 nd neighbour shell nuclei give j (2n j I + 1) = 19x37 = 703 epr lines. ENDOR will be spread over a considerable range of frequency. Anisotropic and isotropic interactions will fall off with distance All are of I = 3/2 i.e., hfcc + Qcc + differing n Hence EPR give no indication of any structure. ENDOR 0.5 to 26 MH z Narrowest line 10KH z Quadrupolar contribution added n1 = |1/2[A || + A (3cos 2 - 1)] - g n n B + 3P(3cos 2 - 1) (M I - )|/h n2 = | - [A || + A (3cos 2 - 1)] - g n n B + 3P(3cos 2 - 1) (M I - )|/h Where P = e 2 qQ/4I(2I 1).")
24
Pulsed ENDOR Uses pulsed MW and RF In a pulsed ENDOR, the intensity of electron spin echo is measured as a function of the radio frequency. Advantages: (i) Entire sequence can be made short enough to exclude unwanted and competing relaxation effects. (ii) Pulsed ENDOR efficiency upto 100% while the CWENDOR is only a few %
 Entire sequence can be made short enough to exclude unwanted and competing relaxation effects. (ii) Pulsed ENDOR efficiency upto 100% while the CWENDOR is only a few %.")
25
Mims-ENDOR In 1965, Mims proposed the pulse ENDOR experiment shown in Figure 1. The original pulse scheme is based on the stimulated echo sequence with three non-selective mw pi/2 pulses. The first two mw pulses create a periodic polarization pattern across the inhomogeneously broadened EPR line. During the mixing period a selective rf pi pulse of variable frequency is applied. If the rf pulse is on-resonance with a NMR transition, the populations in this transition will be changed and consequently also the polarization pattern. This change is then measured as a function of the rf via the stimulated echo intensity created by the third non-selective pi/2 pulsestimulated echo sequence In a Mims-ENDOR experiment, the ENDOR signal intensity depends also on the hyperfine coupling constant A and on the time tau between the first two mw pulses. For certain values of tau, there is no ENDOR effect. Such blind spots are particularly troublesome in ENDOR spectra of disordered systems, where the knowledge of the proper line shape may be essential. [1] W.B. Mims, "Pulsed endor experiments", Proc.R.Soc.London, 283, 452 (1965).
..")
26
Davies-ENDOR The pulse ENDOR scheme introduced by Davies [1] is based on selective mw pulses. A mw pulse is considered to be selective, if it only affects a single EPR line. Figure 1 shows the Davies-ENDOR pulse sequence. The selective mw pi pulse inverts the polarisation of an allowed EPR transition. During the mixing period, a selective rf pi puls is applied. If the rf pulse is on-resonance with a NMR transition, the polarization of this transition will be inverted and consequently, the polarization of the allowed EPR transitions will disappear. The change in the polarization of the EPR transition, selectively excited by the preparation pulse is then measured as a function of the rf via an echo created by two selective mw pulses. [1] E. R. Davies, "A new pulse ENDOR technique", Phys. Lett., 47A, 1 (1974).
![Davies-ENDOR The pulse ENDOR scheme introduced by Davies [1] is based on selective mw pulses.](http://images.slideplayer.com/14/4310320/slides/slide_26.jpg "A mw pulse is considered to be selective, if it only affects a single EPR line. Figure 1 shows the Davies-ENDOR pulse sequence. The selective mw pi pulse inverts the polarisation of an allowed EPR transition. During the mixing period, a selective rf pi puls is applied. If the rf pulse is on-resonance with a NMR transition, the polarization of this transition will be inverted and consequently, the polarization of the allowed EPR transitions will disappear. The change in the polarization of the EPR transition, selectively excited by the preparation pulse is then measured as a function of the rf via an echo created by two selective mw pulses. [1] E. R. Davies, A new pulse ENDOR technique , Phys. Lett., 47A, 1 (1974)..")
27
Chirp Time-Domain ENDOR Spectroscopy Conventional ENDOR methods observe the nuclear frequencies during radio frequency (rf) irradiation which leads to power broadening. It was first proposed by Hoefer et al. to use time-domain observation for the elimination of this broadening mechanism [1]. However, time-domain ENDOR poses the technical problem of exciting nuclear transitions in a frequency band of about 20 MHz width. This can be done by using chirp pulses instead of the usual monochromatic irradiation, i.e., by sweeping the rf linearly through the required frequency range during the pulse [95.6]. It can be shown that the optimum flip angle of the chirp pulse for the single transitions is smaller than pi/2 and that it can be achieved for typical systems with standard pulse ENDOR instrumentation. Because of the multiplex advantage, chirp time-domain ENDOR features higher sensitivity than established pulse ENDOR experiments, in particular if only a few ENDOR lines are spread over a broad frequency band. Another advantage is that concepts from ESEEM can easily be adapted to time- domain ENDOR, e.g. the ENDOR analogon to HYSCORE [2] is obtained just by introducing a pi pulse into the sequence.[95.6] [1] P. Höfer, A. Grupp, and M. Mehring, "High-resolution time-domain electron-nuclear-sublevel spectroscopy by pulsed coherence transfer", Phys. Rev. A 33, 3519 (1986) [2] P. Höfer, A. Grupp, H. Nebenführ, and M. Mehring, "Hyperfine sublevel correlation (HYSCORE) spectroscopy: A 2D ESR investigation of the squaric acid radical", Chem. Phys. Lett. 132, 279 (1986)
 [2] P. Höfer, A. Grupp, H. Nebenführ, and M. Mehring, Hyperfine sublevel correlation (HYSCORE) spectroscopy: A 2D ESR investigation of the squaric acid radical , Chem. Phys. Lett. 132, 279 (1986).")
28
Comparison of Davies- and Chirp ENDOR spectra of bis(glycinato)copper(II)
copper(II)")
29
2D Chirp ENDOR of bis(glycinato)copper(II)
copper(II)")
30
Comparison of ENDOR and ESEEM experiments

31
23 Na ENDOR spectrum of the Fe(CN) 6 3- complex in NaCl, for four different orientations. The contribution of the nuclear Zeeman interaction (around 80 MHz) is subtracted. FIR (ESR) frequency 244.996GHz.
 is subtracted. FIR (ESR) frequency GHz..")
32
ENDOR spectrum of the Fe(CN) 6 3- complex in NaCl in the 18-27 MHz range.B || [100] = 6.0017 Tesla. FIR (ESR) frequency 244.996 GHz.
![ENDOR spectrum of the Fe(CN) 6 3- complex in NaCl in the MHz range.B || [100] = Tesla.](http://images.slideplayer.com/14/4310320/slides/slide_32.jpg "FIR (ESR) frequency GHz..")
33
EPR spectrum of 2,2,6,6-tetramethyl-1-piperidinyl-oxy (TEMPO) in toluene- d 8 + 10% dimethylformamide-d 7 at 285.135GHz and 40K. The spectrum is fitted with the g-values g zz = 2.00214(4), g yy = 2.00620(4) and g xx = 2.00972(4). The hyperfine splitting due to the nitrogen nucleus is only visible along the z- direction (93.5MHz).
, g yy = (4) and g xx = (4). The hyperfine splitting due to the nitrogen nucleus is only visible along the z- direction (93.5MHz)..")
34
ENDOR spectra of 2,2,6,6-tetramethyl-1-piperidinyl-oxy (TEMPO) in toluene-d 8 + 10% dimethylformamide-d 7 at 285.135GHz and 3.0K. The magnetic field varies from 10.132(top) to 10.176(bottom) in 2mT steps.
 to (bottom) in 2mT steps..")
35
Example 1: EPR and corresponding ENDOR spectrum (recorded at 4K) of a Cu doped MgO catalyst. The ENDOR spectrum clearly reveals the coordination environment of the Cu 2+ ions, which are surrounded by 5 distinct OH groups. The weak interactions between the Cu 2+ ion and the proton are clearly not visible in the EPR spectrum. ENDOR spectrum

36
Example 2: EPR and ENDOR spectrum (100K) of a surface defect center (an F S + (H) colour center) on a polycrystalline oxide surface. The ENDOR spectrum clearly shows the magnitude of the coupling between the surface trapped electron and a nearby proton. Despite the complex heterogeneous nature of the polycrystalline oxide sample, the resolution of the ENDOR signals is excellent. EPR spectrum ENDOR spectrum

37
Thank you

Similar presentations


 On-resonance: M z -> -M y Off-resonance: phase >")


 Spectroscopy>")
>")

>")


 can show distorted patterns. When ν >> J, the spectra is said to be first-order. Non-first-order.>")
>")


 that are proportional to the sensitivity of the nuclei we are studying. In multiple.>")
 A photon generates both an electric and a magnetic field A current passing through a wire also generates both an electric and a magnetic.>")

