Download presentation
Presentation is loading. Please wait.

1
Click here to enter

2
Click a menu option to view more details Starters Main Courses Desserts Click on the coffee cup to return when Navigating For Vocabulary Subject Related Content and tutorials For drill and practice applet

3
Please make your choice from the following selections Click on the document below to see Essential vocabulary for unit 1

4
Please make your choice from the following selections Graphing in Graphical Analysis/Logger Pro

5
1. To begin click the problem button 2. When finished, hit solution to see the answer 3. Hit problem again to get a new problem 4. Hit the coffee cup to return to the previous menu ProblemSolution P = 2 (m) X 2 + 1 m^3 P(m^3) X(m) P(m^3) versus X(m)
 X m^3 P(m^3) X(m) P(m^3) versus X(m).")
7
Adding a mathematical model Labeling your graph Additional Column and Graph Options

8
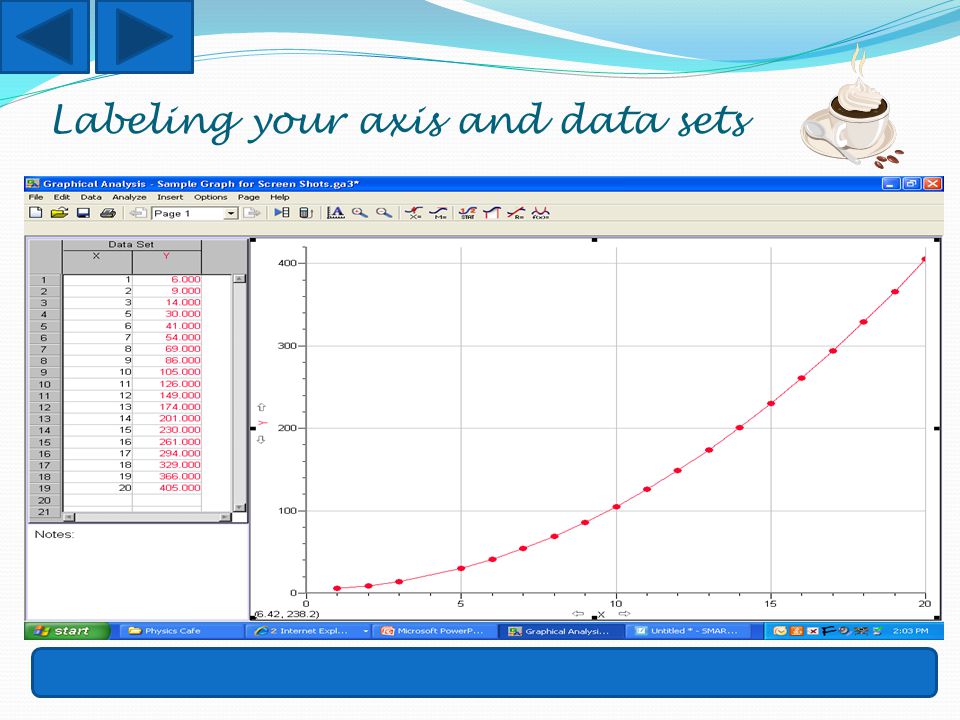
Adding a title Labeling your axis and data sets

10
Click here to begin

11
First determine a mathematical model using graphical analysis/logger pro

12
Swap your x and y variables in the math equation for their physics variables based on how you graphed your data.

13
Adding titles to your graph

15
Right click on your graph and choose Graph Options

16
Adding titles to your graph Select the graph options tab

17
Adding titles to your graph In the title box, type your graph title. Then select done to close the box

18
Adding titles to your graph

19
Using Graphical Analysis/Logger Pro Adding titles to your graph Click here to repeat the tutorial Click here to return to the Labeling your Graph Tutorial Menu Or click the mug to return to the main menu

20
Labeling your axis and data sets

22
Right Click on the data table and select Column Options

23
Labeling your axis and data sets Choose Data Set X

24
Labeling your axis and data sets Type in the variable name in the Name Box

25
Labeling your axis and data sets Type the symbol in the Short Name Box

26
Labeling your axis and data sets

27
Type the unit in the unit box

28
Labeling your axis and data sets Click done to finish

29
Labeling your axis and data sets Repeat for the Y variable

30
Labeling your axis and data sets

31
Constant Velocity Position versus Time Graph Click here to repeat the tutorial Click here to return to the Labeling your Graph Tutorial Menu Or click the mug to return to the main menu

32
Adding a mathematical Model

33
First add a title and label your graph. See other tutorials for instructions

34
Adding a mathematical Model

35
Then select the analyze menu

36
Adding a mathematical Model Choose curve fit

37
Adding a mathematical Model Then check the graph type using your final packet page as a reference

38
Adding a mathematical Model Then check the graph type using your final packet page as a reference

39
Adding a mathematical Model This graph looks quadratic so select the quadratic option

40
Adding a mathematical Model

41
Then Select Try Fit

42
Adding a mathematical Model If the projected black line is a good fit, select done. Otherwise choose another graph option until you get a good fit.

43
Adding a mathematical Model

44
The pop-up box contains your math fit.

45
Adding a mathematical Model The pop-up box contains your math fit. This line contains the math equation Each of these represent a number term in the equation. So in the above equation the A is 1 The B is 0 And the C is 5 Note the scientific notation in the B term. It has E-015 next to the number. This means 3.37 x 10 -17 so it is an extremely small number so we can assume it is zero.

46
Using Graphical Analysis/Logger Pro Adding a mathematical Model Click here to repeat the tutorial Or click the mug to return to the main menu

47
Additional Graph and Column Options

48
Graphical Analysis is a powerful graphing program with many advanced features besides just creating simple graphs and finding mathematical relationships. This tutorial will show you how to use some of the more advanced Graph and Columns options present in graphical Analysis. These features include: 1. How to add additional Columns that have values based on an equation 2. How to auto Fill a Column with generated values 3. How to control what is being graphed on a graph axis when I have more then 2 Columns in my data table. 4. How to add additional graphs 5. How to auto arrange my graphs so they have a clear layout.

49
Additional Graph and Column Options To use Graphical Analysis to create a calculated Column select the Data Tab

50
Additional Graph and Column Options Then Choose New Calculated Column

51
Additional Graph and Column Options This will bring up a box similar to the Column Option box

52
Additional Graph and Column Options Fill in your Name, Short Name, and Units just like before

53
Additional Graph and Column Options Type your equation in the equation box

54
Additional Graph and Column Options To add variables from other columns, select the variables(columns) button
 button")
55
Additional Graph and Column Options When finished select done

56
Additional Graph and Column Options Observe your new calculated column

57
Additional Graph and Column Options To generate values to fill a column, you again select the column options menu

58
Additional Graph and Column Options On the right hand side of the menu is a check box to generate values

59
Additional Graph and Column Options Select the check box, then set up what values you want to add

60
Additional Graph and Column Options Select done when finished

61
Additional Graph and Column Options Observe that the X column now has generated values

62
Additional Graph and Column Options To change what columns are being graphed, left click on the axes label

63
Additional Graph and Column Options Then select the column that you want to appear on that axis

64
Additional Graph and Column Options In this case I have plotted my calculated column versus my auto filled column

65
Additional Graph and Column Options To add another graph, select the insert tab, then choose graph

66
Additional Graph and Column Options

67
To auto arrange your graphs, select the page tab and then select Auto Arrange

68
Additional Graph and Column Options From here you can change what is plotted on the different graphs axis based on what you are graphing and working with.

69
Using Graphical Analysis/Logger Pro Additional Graph and Column Options Click here to repeat the tutorial Or click the mug to return to the main menu

70
If you have a y-intecept give it units of the y physics variable

71
Either click here to repeat the tutorial or click the mug and return to the main menu

Similar presentations


 What quantity are you going to plot on the x axis? What are the.>")


www.iseesystems.com Tutorial Developed by: (www.globe.gov/carboncycle)www.globe.gov/carboncycle.>")