Download presentation
Presentation is loading. Please wait.

2
01: Introduction to Ultrasound George David, M.S. Associate Professor of Radiology

3
Speaker transmits sound pulses Microphone receives echoes Acts as both speaker & microphone › Emits very short sound pulse › Listens a very long time for returning echoes Can only do one at a time

4
Voltage generated when certain materials are deformed by pressure Reverse also true! › Some materials change dimensions when voltage applied dimensional change causes pressure change › when voltage polarity reversed, so is dimensional change V

5
What does your scanner know about the sound echoes it hears? Acme Ultra- Sound Co. I’m a scanner, Jim, not a magician.

6
How loud is the echo? inferred from intensity of electrical pulse from transducer

7
What was the time delay between sound broadcast and the echo?

8
Direction sound was emitted

9
The sound’s pitch or frequency

10
Sound travels at 1540 m/s everywhere in body › average speed of sound in soft tissue Sound travels in straight lines in direction transmitted Sound attenuated equally by everything in body › (0.5 dB/cm/MHz, soft tissue average)
")
11
Sound travels at 1540 m/s everywhere in body › average speed of sound in soft tissue Sound travels in straight lines in direction transmitted Sound attenuated equally by everything in body › (0.5 dB/cm/MHz, soft tissue average)
")
12
Dot position ideally indicates source of echo scanner has no way of knowing exact location › Infers location from echo ?

13
Scanner aims sound when transmitting echo assumed to originate from direction of scanner’s sound transmission ain’t necessarily so ?

14
Time delay accurately measured by scanner distance = time delay X speed of sound distance

15
scanner assumes speed of sound is that of soft tissue › 1.54 mm/ sec › 1540 m/sec › 13 usec required for echo object 1 cm from transducer (2 cm round trip) distance = time delay X speed of sound 1 cm 13 sec Handy rule of thumb
 distance = time delay X speed of sound 1 cm 13 sec Handy rule of thumb")
16
Sometimes ? soft tissue ==> 1.54 mm / sec fat ==> 1.44 mm / sec brain ==> 1.51 mm / sec liver, kidney ==> 1.56 mm / sec muscle ==> 1.57 mm / sec Luckily, the speed of sound is almost the same for most body parts

17
Ultrasound is gray shade modality Gray shade should indicate echogeneity of object ? ?

18
Based upon intensity (volume, loudness) of echo ? ?
 of echo")
19
Loud echo = bright dot Soft echo = dim dot

20
Deep echoes are softer (lower volume) than surface echoes.
 than surface echoes.")
21
Correction needed to compensate for sound attenuation with distance Otherwise dots close to transducer would be brighter

22
scanner assumes entire body has attenuation of soft tissue › actual attenuation varies widely in body Fat0.6 Brain0.6 Liver0.5 Kidney0.9 Muscle1.0 Heart1.1 Tissue Attenuation Coefficient (dB / cm / MHz)
")
23
Assumptions made by scanner cause artifacts when assumed conditions not true All sound in body travels at same speed Sound travels only in straight lines Sound attenuated equally by everything in body

24
Distance = Speed X Time Delay / 2 1380 m/s X 58usec / 2 = 4 cm Actual Distance to interface 1540 m/s X 58usec / 2 = 4.47 cm Calculated Distance to interface Assumed Accurately Measured Assumed speed Actual speed Actual object position X Imaged object position X

25
Incorrect dot placement can result in incorrect › Object placement › Object size › Object shape Actual object position X Imaged object position X

26
Position of Object on Image Actual Object Position X Multipath Artifact X

28
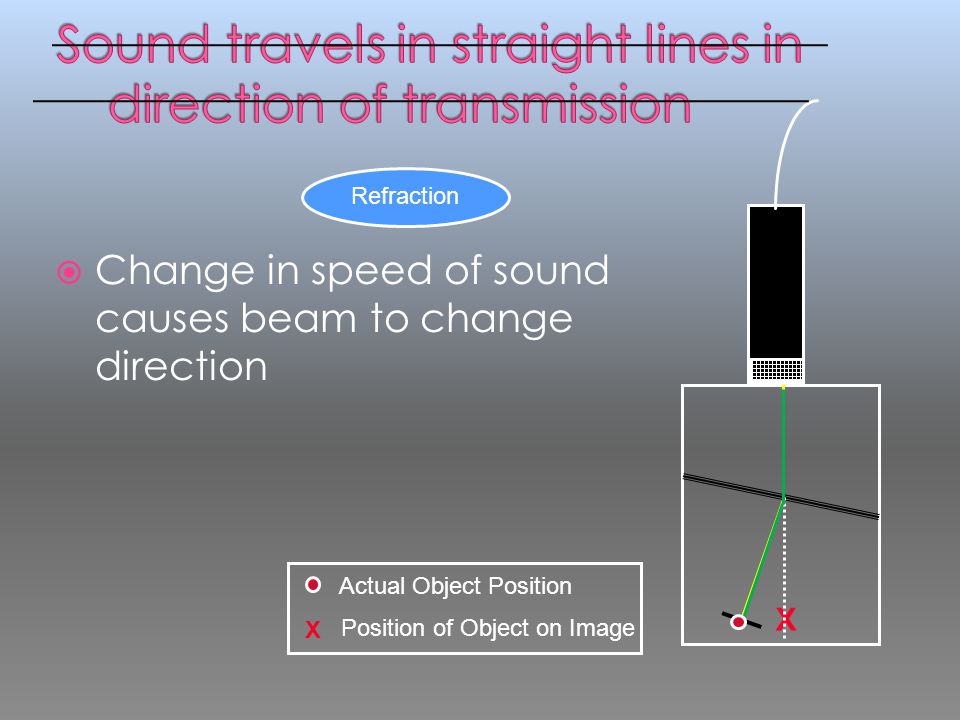
Actual Object Position X Position of Object on Image X Refraction Change in speed of sound causes beam to change direction

29
reflection from reflector “2” splits at “I” some intensity re- reflected toward “2” Result › later false echoes heard › scanner places dots behind reflector “2” 1 2 Echo #1Echo #2Echo #3

30
Comet tail › dozens of multiple reflections between transducer & reflector 2 reflectors

31
Comet tail › dozens of multiple reflections between transducer & reflector 2 reflectors Mirror Image › common around strong reflectors Diaphragm Pleura

32
Scanner emits 2 nd pulse before all reflections received from 1st pulse scanner assumes echo from 2nd pulse places echo too close & in wrong direction X Actual Object Position X Position of Object on Image

33
Scanner assumes soft tissue attenuation 0.5 dB/cm per MHz

34
Attenuates more than.5 dB/cm/MHz Shadowed Reflector http://raddi.uah.ualberta.ca/~hennig/teach/cases/artifact/noframe/imag2-f2.htm

35
Attenuates less.5 dB/cm/MHz Enhanced reflector http://raddi.uah.ualberta.ca/~hennig/teach/cases/artifact/noframe/imag6-f1.htm

36
Results from random interference between scattered echoes from many reflectors

37
Ich heisse Johaan Christian Doppler

38
difference between received & transmitted frequency caused by relative motion between sound source & receiver Frequency shift indicative of reflector speed IN OUT

39
change in pitch of as object approaches & leaves observer › train › Ambulance siren moving blood cells › motion can be presented as sound or as an image

40
Doppler spectrum speckle Cause › same as acoustic speckle › random constructive & destructive interference from sound scattered in blood

41
duplicate vessel image visible on opposite side of strong reflector Analogous to mirror image artifact Doppler data also duplicated Femoral vein duplication in region of adductor canal. Duplication of left vertebral artery in Doppler ultrasonography: arrows duplicated left vertebral arteries, LC left common carotid artery

42
Sufficient Sampling Insufficient Sampling

43
Results in detection of improper flow direction occurs because sampling rate too slow Similar to wagon wheels rotating backwards in movies

44
Which way is this shape turning? #1#2#3

45
Does it help to sample more often? #1 #2 #1A

46
All else staying equal, larger reflector speed must produce larger Doppler shift 77 X f D (kHz) v (cm/s) = -------------------------- f o (MHz) X cos
 v (cm/s) = f o (MHz) X cos ")
47
Lower operating frequency results in lower Doppler shift 77 X f D (kHz) v (cm/s) = -------------------------- f o (MHz) X cos Constant
 v (cm/s) = f o (MHz) X cos Constant")
48
larger Doppler angle results in › Lower cos( ) › Lower Doppler shift 77 X f D (kHz) v (cm/s) = -------------------------- f o (MHz) X cos( Constant
 › Lower Doppler shift 77 X f D (kHz) v (cm/s) = f o (MHz) X cos( Constant")
49
decrease imaging depth increase pulse repetition frequency › Increases sampling rate › Lessens aliasing BUT › increases likelihood of range ambiguity for pulsed instruments Range Ambiguity Trade-off Triangle Depth Lines / FrameFrames / sec (dynamics)
")
50
operator instructs scanner to assume aliasing occurring › scanner does calculations based on operator’s assumption scanner cannot independently verify

Similar presentations