Download presentation
Presentation is loading. Please wait.

1
The status of science to support REDD+ based mitigation policies of Mexico Bernardus de Jong, El Colegio de la Frontera Sur Fernando Paz, Colegio de Postgraduados Marcela Olguin, El Colegio de la Frontera Sur Jorge D. Etchevers, Colegio de Postgraduado Carlos Omar Cruz, Instituto Nacional de Estadística y Geografía 3rd NACP ALL-INVESTIGATORS MEETING, New Orleans January 31-Febr 4 NACP: Science to Inform Carbon Management and Future Projections Thursday, February 3

2
REDD+ is accepted at COP16: Emission reductions Stock conservation and enhancement (removals) 1. Stock * LU-change 2. Stock change * LU-change Deforestation DegradationDeforestation Reforestation Recovering 1. 2. 1. 2.

3
Bottom up-Top down Strategy

4
Reference emission scenario Annual rates of change (ha/yr), based on national LU maps 1993-20022002-2007 Gross Deforestation595,400590,400 Reforestation (natural and planted)264,600392,700 Net Deforestation330,800197,700 Degradation633,000415,800 Recovering176,000109,400 Net Degradation457,000306,400 Historical rates of forest conversion
, based on national LU maps Gross Deforestation595,400590,400 Reforestation (natural and planted)264,600392,700 Net Deforestation330,800197,700 Degradation633,000415,800 Recovering176,000109,400 Net Degradation457,000306,400 Historical rates of forest conversion")
5
5 * 5 km in forested areas (1600 m2) 20 * 20 km in non-forested areas Quantitative data on trees and shrubs Semi-quantitative data on other pools Litter, CWD and Soil carbon measurements from 2009 onward 20% re-measured every year Develop biomass density maps to estimate level of emissions from LU-change. National inventory data and national database of biomass equations

6
Allometric equations to convert inventory and other data to volume or biomass Biomass Volume Addionally: 4 Generic equations for trees according to ecosystem (Tropical humid, tropical dry, cloud forest, scrub desert)
")
7
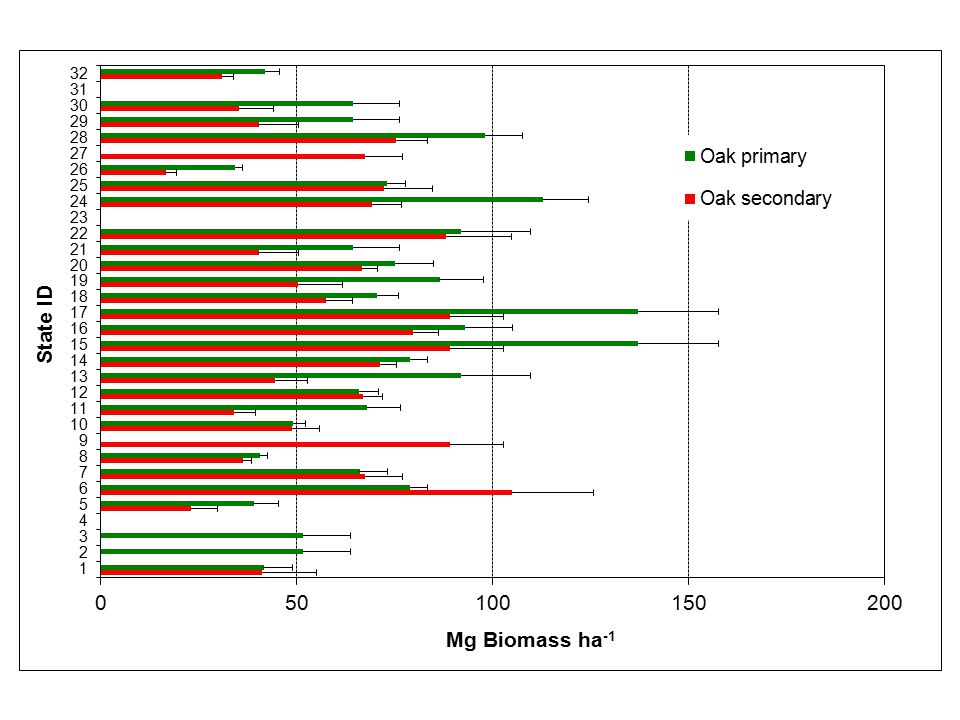
Estimate biomass density in each forest type

9
Assign biomass densities to each polygon of the LU maps (Trees and shrubs) 250 0
 250 0")
10
Age Biomass (Mg/ha) Methodologies to estimate growth Chronosequence Growth ring analysis Permanent monitoring plots Stock change:
 Methodologies to estimate growth Chronosequence Growth ring analysis Permanent monitoring plots Stock change:")
11
Identify forest areas that are under high risk due to drivers

12
Bottom up-Top down Strategy

13
81.3% forests and 18.2% grasslands 73.3% with tree dominated canopy. 66.1% are degraded forest. BIOSPHERE RESERVE «EL OCOTE» SCALE EFFECT 1:250,000 1:5,000 88.2% forests y 10.5% grasslands. 70.1% with tree dominated canopy. 30.2% are degraded forests. Intact forest Degraded forest Non-forest

14
Detailed mapping from satellite images to develop community-based reference scenarios and monitoring systems Satelllite derived LU maps combined with land tenure maps

16
Pilot “Chiapas” Semi-intensive and rapid Appraisal “El Ocote” MRV Intensive Forest Inventory Plots (Emission factors)
")
18
EXAMPLE IN A PROPERTY

19
Reference Emission Scenario Community 5-year LU Plan REDD+ compared to Emission scenario Forest fires CO 2 fluxes 1991- 2009 Mg CO 2 /ha/yr

20
THANK YOU bjong@ecosur.mx

Similar presentations


 James Wheeler PhD Student Supervisors: Dr. Kevin Tansey,>")


 REDD+ training materials by GOFC-GOLD, Wageningen.>")