Download presentation
Presentation is loading. Please wait.

1
Landscape Temperature and Frozen/Thawed Condition over Alaska with Infrared and Passive Microwave Remote Sensing Determination of Thermal Controls on Land-Atmosphere Carbon Flux in Support of CARVE N. Steiner 1, K. McDonald 1,2, R. Schröder 1,2, S. Dinardo 2 and C. Miller 2 1. Earth and Atmospheric Sciences, The City College of New York, CUNY, New York, NY, United States. 2. Jet Propulsion Laboratory, California Institute of Technology, Pasadena, CA, United States. CARVE

2
Overview Carbon in the Arctic Vulnerability Experiment (CARVE) Remote Sensing Datasets Freeze/Thaw Passive Microwave Land Surface Temperature Overview CARVE Flights Conclusion/Future Work
 Remote Sensing Datasets Freeze/Thaw Passive Microwave Land Surface Temperature Overview CARVE Flights Conclusion/Future Work")
3
Carbon in the Arctic Vulnerability Experiment (CARVE) - Overview Key Science Questions: What are the sensitivities of the Alaskan Arctic carbon cycle and ecosystems to climate change? How does interannual variability in surface controls (e.g., soil moisture) affect landscape-scale atmospheric concentrations and surface-atmosphere fluxes of CO2 and CH4 in the Alaskan Arctic? What are the impacts of fire and thawing permafrost on the Alaskan Arctic carbon cycle and ecosystems?
 affect landscape-scale atmospheric concentrations and surface-atmosphere fluxes of CO2 and CH4 in the Alaskan Arctic. What are the impacts of fire and thawing permafrost on the Alaskan Arctic carbon cycle and ecosystems .")
4
Remote Sensing Data System Determine various surface controls Freeze/Thaw Surface Temperature Soil Moisture / Inundation Volume of daily data 21 Level Grids for Alaska (1 + 3 km gridding) Generated in near real-time (when possible) Support flight planning Identify of interest SciDB – An Array-Based Analytical DBMS Handles sparse (swath) and dense (grid) arrays Contains both Query (SQL-like) and Functional language Linear algebra on very large arrays Scalable scidb.org
 Generated in near real-time (when possible) Support flight planning Identify of interest SciDB – An Array-Based Analytical DBMS Handles sparse (swath) and dense (grid) arrays Contains both Query (SQL-like) and Functional language Linear algebra on very large arrays Scalable scidb.org")
5
SciDB: Swath to Grid Processing Time Dimension Dense Grid Data Latitude Dimension Longitude Dimension Sparse Swath Data Column Dimension Row Dimension Moving Window Aggregation Swath to grid processing done in-storage Window size set to satellite footprint

6
brightness temperature, vertical pol. [K] Advanced Microwave Scanning Radiometer 2 (AMSR2) Gridded at 3 km
 Gridded at 3 km.")
7
Example: September 25, 2013 (6-day) MODIS LST [ o K] Day Night MODIS LST [ o K] MODIS Land Surface Temperature MODIS (MOD11) LST and Emissivity Product Standard split-window CARVE Generated Daily Grids 1 km grid centers Combined Aqua and Terra Separate Day, Night 6 Day forward-filling to replace missing observations Gridded using moving window aggregation
![Example: September 25, 2013 (6-day) MODIS LST [ o K] Day Night MODIS LST [ o K] MODIS Land Surface Temperature MODIS (MOD11) LST and Emissivity Product Standard split-window CARVE Generated Daily Grids 1 km grid centers Combined Aqua and Terra Separate Day, Night 6 Day forward-filling to replace missing observations Gridded using moving window aggregation](http://images.slideplayer.com/14/4290906/slides/slide_7.jpg "Example: September 25, 2013 (6-day) MODIS LST [ o K] Day Night MODIS LST [ o K] MODIS Land Surface Temperature MODIS (MOD11) LST and Emissivity Product Standard split-window CARVE Generated Daily Grids 1 km grid centers Combined Aqua and Terra Separate Day, Night 6 Day forward-filling to replace missing observations Gridded using moving window aggregation")
8
AMSR2 Freeze/Thaw Algorithm Coldfoot AWS Snow Depth Soil Temp., 2 m depth Temperature [C] Diurnal ΔT B Seasonal ΔT B Snow Depth [in.] Thresholds (T R ) are determined using surface temperatures TRTR
![AMSR2 Freeze/Thaw Algorithm Coldfoot AWS Snow Depth Soil Temp., 2 m depth Temperature [C] Diurnal ΔT B Seasonal ΔT B Snow Depth [in.] Thresholds (T R ) are determined using surface temperatures TRTR](http://images.slideplayer.com/14/4290906/slides/slide_8.jpg "AMSR2 Freeze/Thaw Algorithm Coldfoot AWS Snow Depth Soil Temp., 2 m depth Temperature [C] Diurnal ΔT B Seasonal ΔT B Snow Depth [in.] Thresholds (T R ) are determined using surface temperatures TRTR")
9
MODIS LST [ o K] Early Summer – Late stages of the freeze/thaw transition Evidence of North Slope Diurnal Melting Corresponds to near-freezing temperatures found in the nighttime MODIS LST Quick-Look Freeze/Thaw Product - Week of June 1, 2013 36 GHz Diurnal Product (AMSR2) Night Day
![MODIS LST [ o K] Early Summer – Late stages of the freeze/thaw transition Evidence of North Slope Diurnal Melting Corresponds to near-freezing temperatures found in the nighttime MODIS LST Quick-Look Freeze/Thaw Product - Week of June 1, GHz Diurnal Product (AMSR2) Night Day](http://images.slideplayer.com/14/4290906/slides/slide_9.jpg "MODIS LST [ o K] Early Summer – Late stages of the freeze/thaw transition Evidence of North Slope Diurnal Melting Corresponds to near-freezing temperatures found in the nighttime MODIS LST Quick-Look Freeze/Thaw Product - Week of June 1, GHz Diurnal Product (AMSR2) Night Day")
10
Coldfoot StationSagwon Station Passive Microwave and Thermal IR - Freeze/Thaw Coldfoot Station Soil temperature [C] Th Tr Fr Comparison of AMSRE freeze/thaw and MODIS surface temperatures Threshold on MODIS LST can be found to separate frozen from thawed state Sagwon Station Soil temperature [C] 2005 2006 2007 2008 Thawed Transitional Frozen Coldfoot Sagwon
![Coldfoot StationSagwon Station Passive Microwave and Thermal IR - Freeze/Thaw Coldfoot Station Soil temperature [C] Th Tr Fr Comparison of AMSRE freeze/thaw and MODIS surface temperatures Threshold on MODIS LST can be found to separate frozen from thawed state Sagwon Station Soil temperature [C] Thawed Transitional Frozen Coldfoot Sagwon](http://images.slideplayer.com/14/4290906/slides/slide_10.jpg "Coldfoot StationSagwon Station Passive Microwave and Thermal IR - Freeze/Thaw Coldfoot Station Soil temperature [C] Th Tr Fr Comparison of AMSRE freeze/thaw and MODIS surface temperatures Threshold on MODIS LST can be found to separate frozen from thawed state Sagwon Station Soil temperature [C] Thawed Transitional Frozen Coldfoot Sagwon")
11
Thermal LST / Passive Microwave Freeze Thaw Comparison AMSR-E F/T and MODIS LSTInSitu Soil F/T and MODIS LST Station Agreement [%]N MODIS Threshold [deg.K] Agreement [%] N MODIS Threshold [deg.K] Toolik91.31%241926591.82%3168278 Sagwon92.48%227526386.47%2751275 Coldfoot (958)92.77%195226685.47%1977270 Bonanza Creek (A01) 96.08%148127086.52%1893276
![Thermal LST / Passive Microwave Freeze Thaw Comparison AMSR-E F/T and MODIS LSTInSitu Soil F/T and MODIS LST Station Agreement [%]N MODIS Threshold [deg.K] Agreement [%] N MODIS Threshold [deg.K] Toolik91.31% % Sagwon92.48% % Coldfoot (958)92.77% % Bonanza Creek (A01) 96.08% %](http://images.slideplayer.com/14/4290906/slides/slide_11.jpg "Thermal LST / Passive Microwave Freeze Thaw Comparison AMSR-E F/T and MODIS LSTInSitu Soil F/T and MODIS LST Station Agreement [%]N MODIS Threshold [deg.K] Agreement [%] N MODIS Threshold [deg.K] Toolik91.31% % Sagwon92.48% % Coldfoot (958)92.77% % Bonanza Creek (A01) 96.08% %")
12
Forward Looking Infrared (FLIR) Imager Aircraft mounted Nadir pointing 40.4x40.5 FOV Measures infrared radiance at 3-5 microns 200 megapixels per second
 Imager Aircraft mounted Nadir pointing 40.4x40.5 FOV Measures infrared radiance at 3-5 microns 200 megapixels per second")
13
CARVE Flight - 10/24/2013 AMSR2, 36GHz V-polarization MODIS–LST, Day (b)(a) (b)
(a) (b)")
14
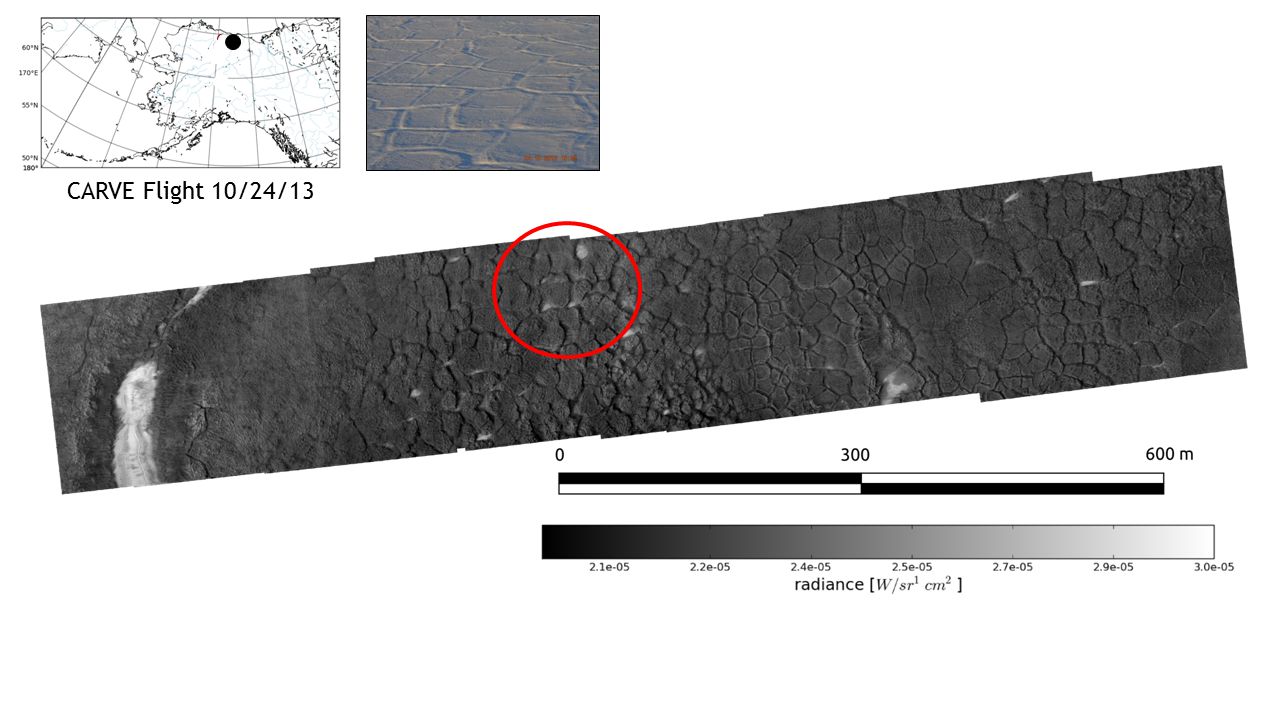
CARVE Flight 10/24/13

16
Conclusions The use of SciDB is found to be well suited for the processing of satellite data for CARVE Successful implementation of an operational freeze/thaw product at near-real-time latency Thermal infrared and passive microwave instruments can be used to observe freeze thaw processes This will enable the use of high resolution monitoring of freeze/thaw processes using FLIR imager Future Work Combine remote sensing products with aircraft and in-situ carbon measurements and surface process modelling Use remote sensing measurements for the spatiotemporal distribution of carbon cycling of CO 2 and CH 4

17
Thank You

Similar presentations


 VOD SOS offset by ecoregion relative to NDVI Greenup date. VOD SOS.>")


-Polar Orbiting Environmental Satellite (POES) Orbital characteristics.>")


 measurement is important for understanding climate change, modeling the hydrological and biogeochemical cycles,>")

