Download presentation
Presentation is loading. Please wait.

1
Introduction to NMR Spectroscopy and Imaging Lecture 10 Basics of Magnetic Resonance Imaging (Spring Term, 2011) Department of Chemistry National Sun Yat-sen University 核磁共振光譜與影像導論
 Department of Chemistry National Sun Yat-sen University 核磁共振光譜與影像導論")
2
Chapter 10 Basics of Magnetic Resonance Imaging Basic principle of MRI Back projection Fourier imaging Image contrast Fast 3D Imaging Functional MRI (fMRI)
")
3
Sources of Materials for this Chapter

4
Micro-imaging Animal imaging Whole-body (human) imaging ( MRI) Scanner = (MRI) Imager = MRI machine = MRI =NMR spectrometer with microimaging function
 imaging ( MRI) Scanner = (MRI) Imager = MRI machine = MRI =NMR spectrometer with microimaging function")
13
Golay Maxwell (Anti-Helmholtz)
")
26
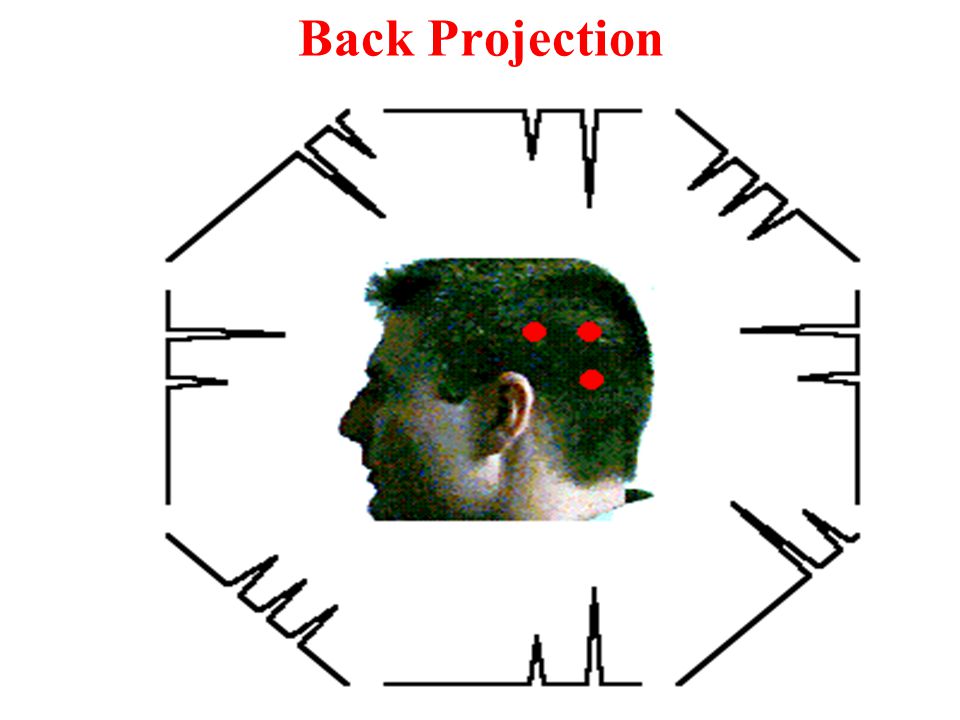
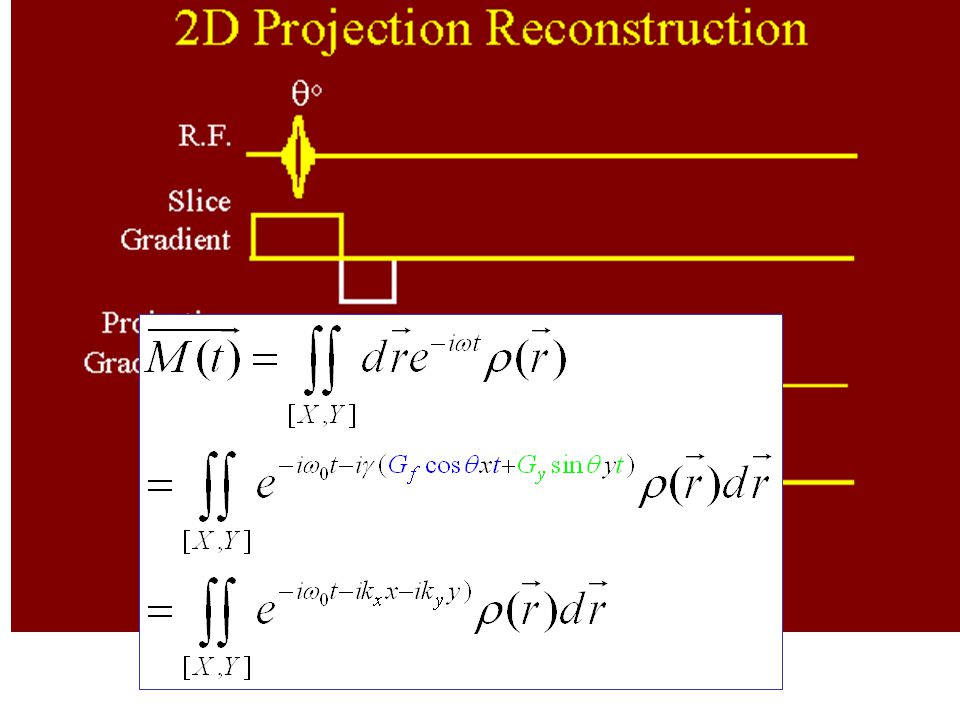
Back Projection

28
Reconstruction

31
Broad band and narrow band pulses (Selective) (Nonselective)
 (Nonselective)")
32
Gaussian Half Gaussian EBURP2 Q5 (Gaussian cascade) Q3 (Gaussian cascade) There are many other selective pulses available. Customer designed pulse shapes can be synthesized on spectrometers at will. Other selective pulses (pulse shaping)
.")
33
With a selective pulse of a definite excitation width of Δν, only a slice of thickness Z is excited (transverse magnetization generated)
")
34
Brute force back projection

36
Problems A sample contains water at two locations, x = 0 cm and x = 2.0 cm. A one- dimensional magnetic field gradient of 1 G/cm is applied along the x-axis during the acquisition of an FID. What frequencies (relative to the isocenter frequency) are contained in the Fourier transformed spectrum? An NMR spectrum is recorded from a sample containing two water locations. The frequency encoding gradient is 1 G/cm along the y-axis. The spectrum contains frequencies of +1000 Hz and -500 Hz relative to the isocenter frequency. What are the locations of the water? You want to excite spins in an xy-plane located at z = -5.0 cm. The resonance frequency at the isocenter is 63.85 MHz and your slice selection gradient is 1 G/cm. Describe in detail the RF pulse which should be used. A sample contains water at two locations, y = 1.0 cm and y = -2.0 cm. A one- dimensional magnetic field gradient is applied along the y-axis during the acquisition of an FID. The frequency encoding gradient is 1 G/cm. What frequencies (relative to the isocenter frequency) are contained in the Fourier transformed spectrum? An NMR spectrum is recorded from a sample containing two water locations. The frequency encoding gradient is 0.5 G/cm along the z-axis. The spectrum contains frequencies of -1000 Hz and +500 Hz relative to the isocenter frequency. What are the locations of the water? You want to excite spins in an xy-plane located at z = -2.0 cm. The resonance frequency at the isocenter is 63.85 MHz and your slice selection gradient is 2 G/cm. Describe in detail the RF pulse which should be used.
 are contained in the Fourier transformed spectrum. An NMR spectrum is recorded from a sample containing two water locations. The frequency encoding gradient is 1 G/cm along the y-axis. The spectrum contains frequencies of Hz and -500 Hz relative to the isocenter frequency. What are the locations of the water. You want to excite spins in an xy-plane located at z = -5.0 cm. The resonance frequency at the isocenter is MHz and your slice selection gradient is 1 G/cm. Describe in detail the RF pulse which should be used. A sample contains water at two locations, y = 1.0 cm and y = -2.0 cm. A one- dimensional magnetic field gradient is applied along the y-axis during the acquisition of an FID. The frequency encoding gradient is 1 G/cm. What frequencies (relative to the isocenter frequency) are contained in the Fourier transformed spectrum. An NMR spectrum is recorded from a sample containing two water locations. The frequency encoding gradient is 0.5 G/cm along the z-axis. The spectrum contains frequencies of Hz and +500 Hz relative to the isocenter frequency. What are the locations of the water. You want to excite spins in an xy-plane located at z = -2.0 cm. The resonance frequency at the isocenter is MHz and your slice selection gradient is 2 G/cm. Describe in detail the RF pulse which should be used..")
39
Single voxel image FT2 = FT1

40
Two-voxel image FT2 Zero-filling FT1

41
Field Of View (FOV) and Image Resolution
 and Image Resolution")
42
Resolution

43
Problems Two samples are located in a magnetic field at x=0 cm and x=5 cm. A 1 G/cm phase encoding gradient is applied in the +X-direction for 10 ms. How much phase will be acquired by the sample located at x=5 cm relative to that located at x=0 cm? You wish to produce an image of hydrogen nuclei in the zx-plane. What directions should the slice, phase, and frequency encoding gradients be applied in? A particular magnetic resonance imager uses a 1 G/cm frequency encoding gradient to produce an image with an 8 cm FOV. What quadrature sampling rate should be used to produce this FOV when imaging hydrogen? You wish to produce an image with a 8 cm FOV and 256 phase encoding gradient steps. The maximum phase encoding gradient you can produce is 1 G/cm. What should the width of the phase encoding gradient be? Show that: FOV = sw / ( γ Gf). Two samples are located in a magnetic field at x=0 cm and x=-4 cm. A 2 G/cm phase encoding gradient is applied in the +X-direction for 5 ms. How much phase will be acquired by the sample located at x=-4 cm relative to that located at x=0 cm? You are using an imaging sequence that applies a slice selection gradient in the x direction, a phase encoding gradient in the z direction, and a frequency encoding gradient in the y direction. What type of imaging plane will be produced? A particular magnetic resonance imager uses a 2 G/cm frequency encoding gradient and a quadrature sampling rate of 32 kHz. What field of view will be obtained when imaging hydrogen? You wish to produce an image with a 4 cm FOV and 512 phase encoding gradient steps. The maximum phase encoding gradient you can produce is 2 G/cm. What should the width of the phase encoding gradient be?
. Two samples are located in a magnetic field at x=0 cm and x=-4 cm. A 2 G/cm phase encoding gradient is applied in the +X-direction for 5 ms. How much phase will be acquired by the sample located at x=-4 cm relative to that located at x=0 cm. You are using an imaging sequence that applies a slice selection gradient in the x direction, a phase encoding gradient in the z direction, and a frequency encoding gradient in the y direction. What type of imaging plane will be produced. A particular magnetic resonance imager uses a 2 G/cm frequency encoding gradient and a quadrature sampling rate of 32 kHz. What field of view will be obtained when imaging hydrogen. You wish to produce an image with a 4 cm FOV and 512 phase encoding gradient steps. The maximum phase encoding gradient you can produce is 2 G/cm. What should the width of the phase encoding gradient be .")
44
Brute force back projection T

45
FT in n-dimension space Image = Spatial FT of original FIDs

46
Brute force back projection T k-space: (t, θ)
")
48
Te t k-space: (t, G x )
")
49
Signal in k-space:M(G x,t) = t GxGx Stack representation Contour representation
 = t GxGx Stack representation Contour representation")
50
t GxGx

52
t θ k-space: (t, θ)
")
53
What does re-grid mean? Original signal: M(Δθ, Δt), M(Δθ,2 Δt), M(Δθ,3 Δt),…M(Δθ, (np/2)*Δt), M(2Δθ, Δt), M(2Δθ,2 Δt), M(2Δθ,3 Δt),…M(2Δθ, np*Δt), …… M(nv*Δθ, Δt), M(nv*Δθ,2 Δt), M(nv*Δθ,3 Δt),…M(nv*Δθ, np*Δt), Regrided signal: M(ΔtcosΔθ, ΔtsinΔθ), M(ΔtcosΔθ, 2ΔtsinΔθ,…, M(ΔtcosΔθ,( np/2)*ΔtsinΔθ M(2ΔtcosΔθ, ΔtsinΔθ), M(2ΔtcosΔθ, 2ΔtsinΔθ,…, M(2ΔtcosΔθ,( np/2)*ΔtsinΔθ …… M(nv*ΔtcosΔθ, ΔtsinΔθ), M(nv*ΔtcosΔθ, 2ΔtsinΔθ,…,M(nv*ΔtcosΔθ,( np/2)*ΔtsinΔθ Just coordinate transformation!
, M(Δθ,2 Δt), M(Δθ,3 Δt),…M(Δθ, (np/2)*Δt), M(2Δθ, Δt), M(2Δθ,2 Δt), M(2Δθ,3 Δt),…M(2Δθ, np*Δt), …… M(nv*Δθ, Δt), M(nv*Δθ,2 Δt), M(nv*Δθ,3 Δt),…M(nv*Δθ, np*Δt), Regrided signal: M(ΔtcosΔθ, ΔtsinΔθ), M(ΔtcosΔθ, 2ΔtsinΔθ,…, M(ΔtcosΔθ,( np/2)*ΔtsinΔθ M(2ΔtcosΔθ, ΔtsinΔθ), M(2ΔtcosΔθ, 2ΔtsinΔθ,…, M(2ΔtcosΔθ,( np/2)*ΔtsinΔθ …… M(nv*ΔtcosΔθ, ΔtsinΔθ), M(nv*ΔtcosΔθ, 2ΔtsinΔθ,…,M(nv*ΔtcosΔθ,( np/2)*ΔtsinΔθ Just coordinate transformation!.")
54
Re-griding y x

57
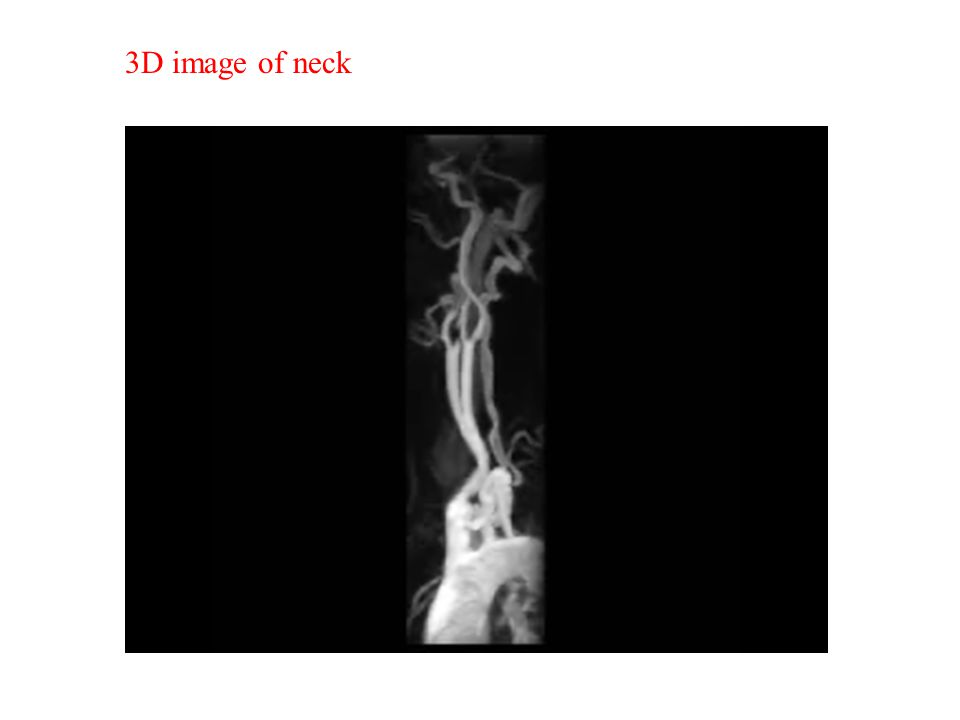
3D image of neck

59
Breathing lung

60
Beating heart

61
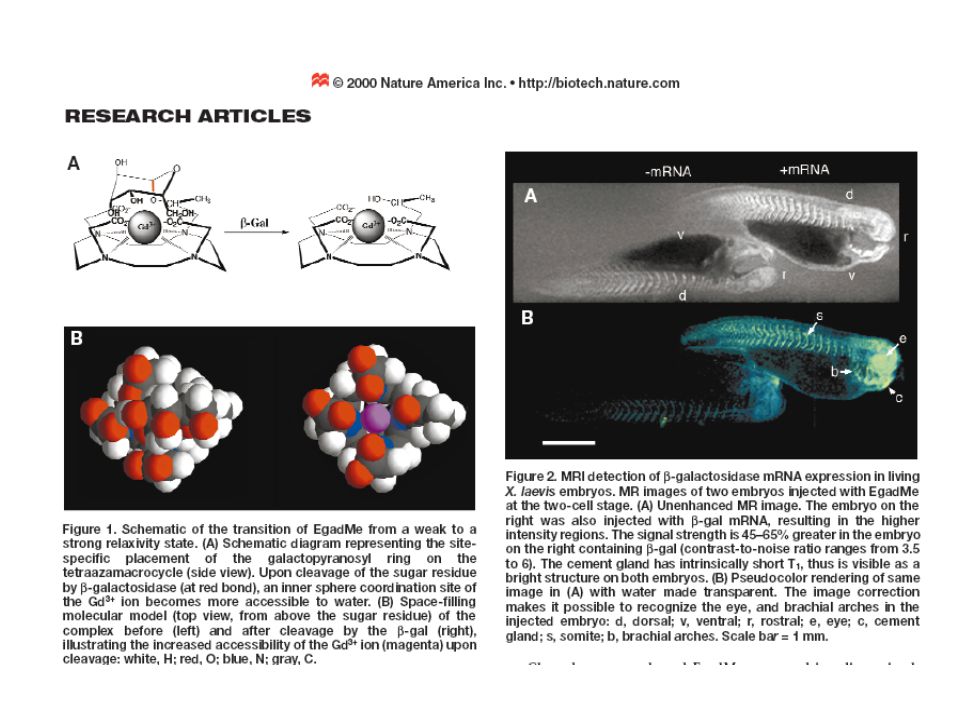
μMRI applications Single Cell Gene Expression Materials

64
Diffusion coefficient images of isolated Aplysia neurons acquired at 8.5 T. The cells are visible as a dark region with low diffusion coefficient within the brighter circle of the capillary tube containing artificial sea water. There is a strong contrast in these images between the nuclear region and the perikaryon, indicating that water molecules in these regions have strongly differing diffusion coefficients. A variety of irregular nuclear morphologies are apparent from the shapes of the bright regions present within the cell bodies J.S. Schoeniger, N. Aiken, E. Hsu, S.J. Blackband, J. Magn.Reson. Ser. B 103 (1994) 261.
")
66
“Smooth” CD surface in the nano-eye Not MRI mimage!

70
Some microimages made in this lab Unknown flower Sesame seed Fuel cell God-fish bone Onion epidermis

71
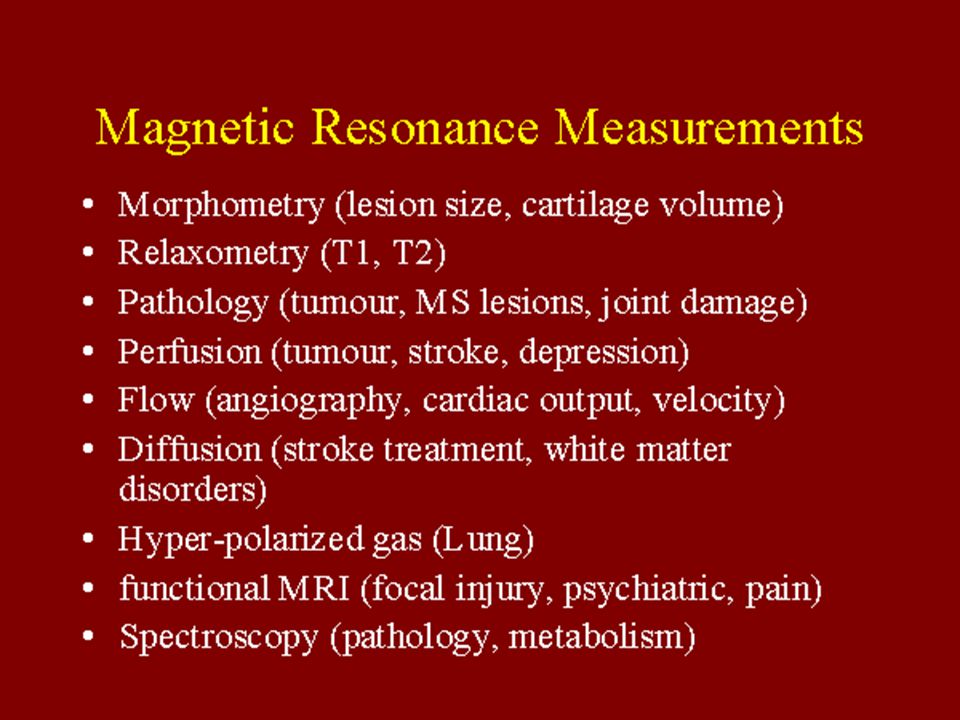
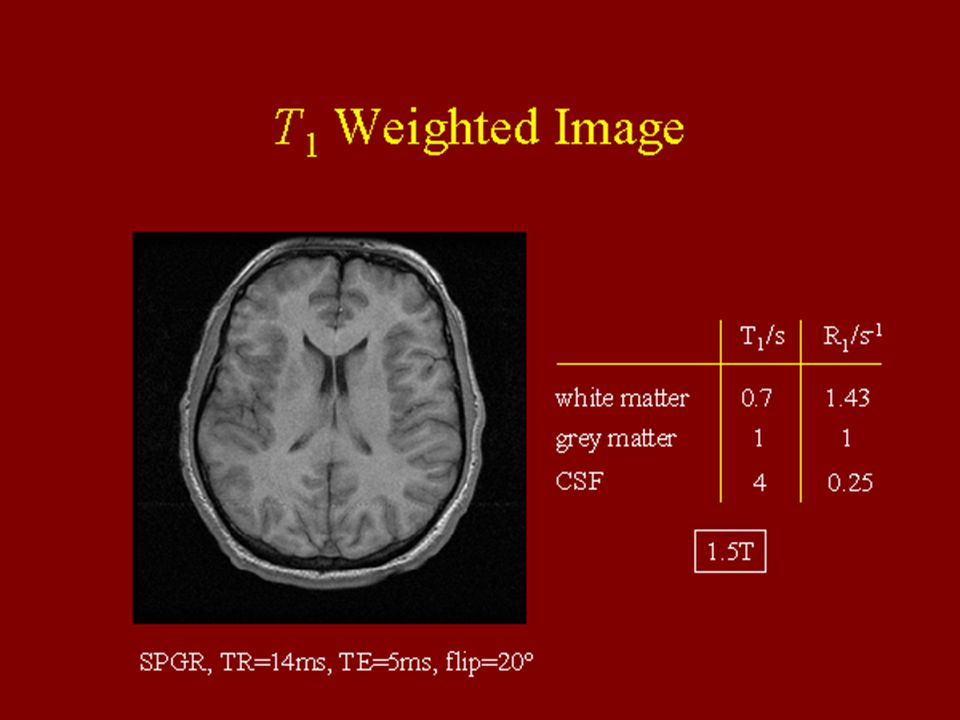
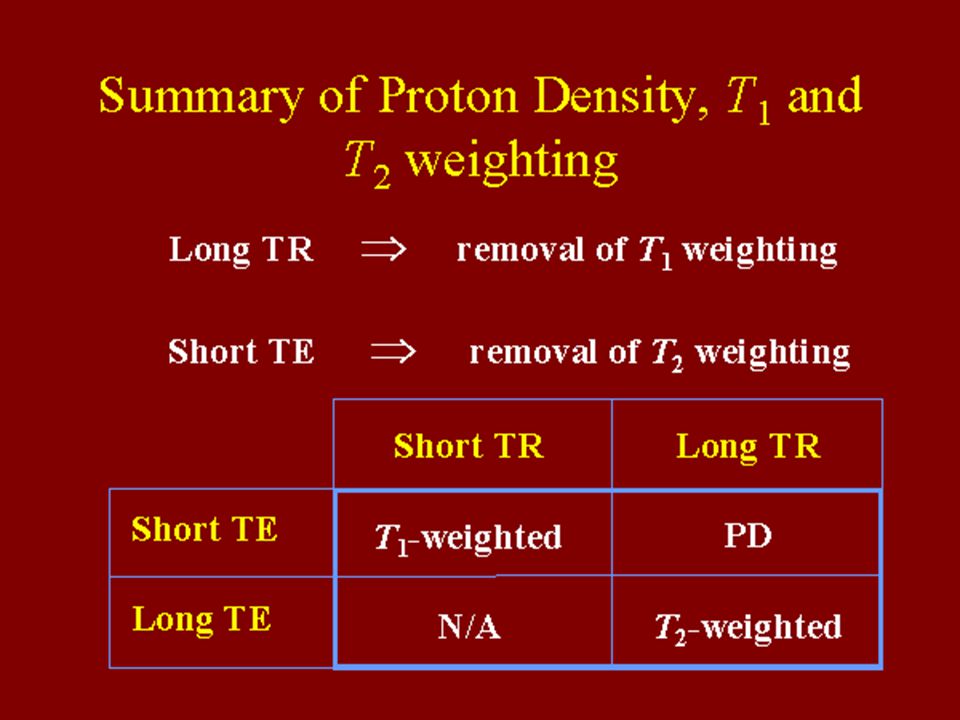
Weighted images Density image is the most basic Relaxation weighting Diffusion weighting Chemical shift weighting Temperature/pressure weighting Multi-quantum relaxation weighting Biochemical/physical weighting Psychological weighting

73
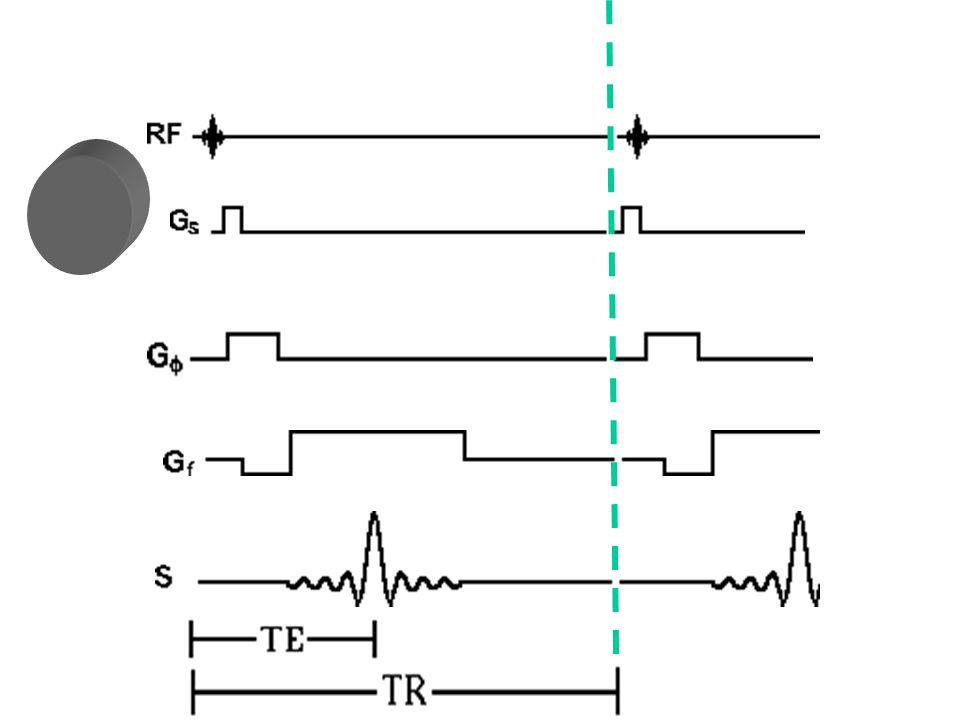
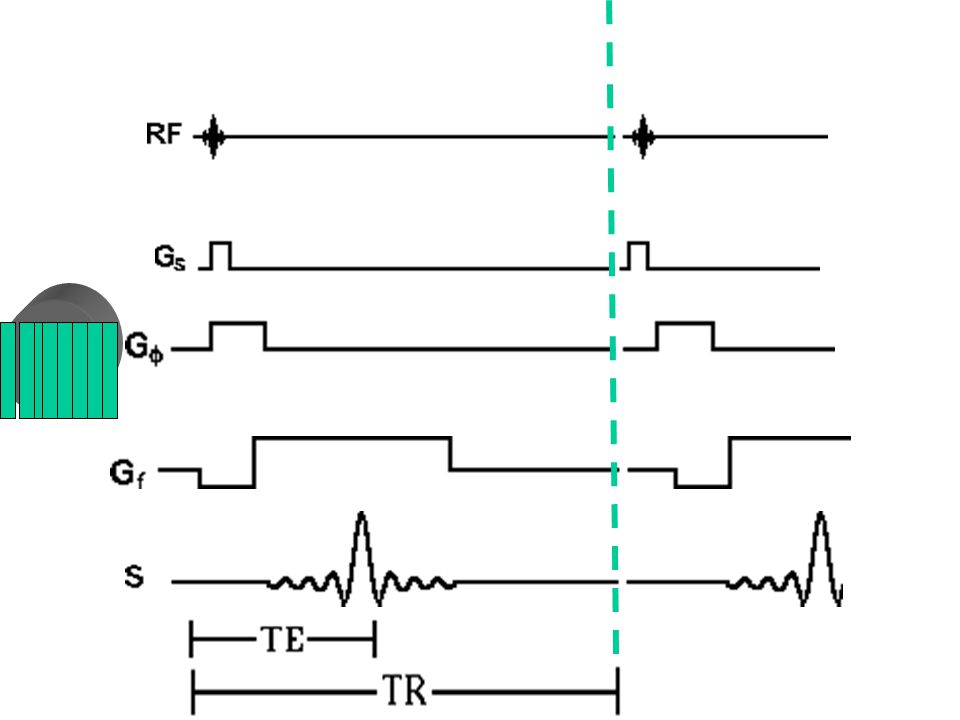
Question: what is the purpose of each of the white gradient fields?

74
Answer: restores the initial alignment of transverse magnetization because the slice- selection gradient field dephase the transeverse magnetization. Answer: shifts the echo (during acquisition) so that the first point is not the echo peak when phase-encoding gradient field is zero.
 so that the first point is not the echo peak when phase-encoding gradient field is zero..")
75
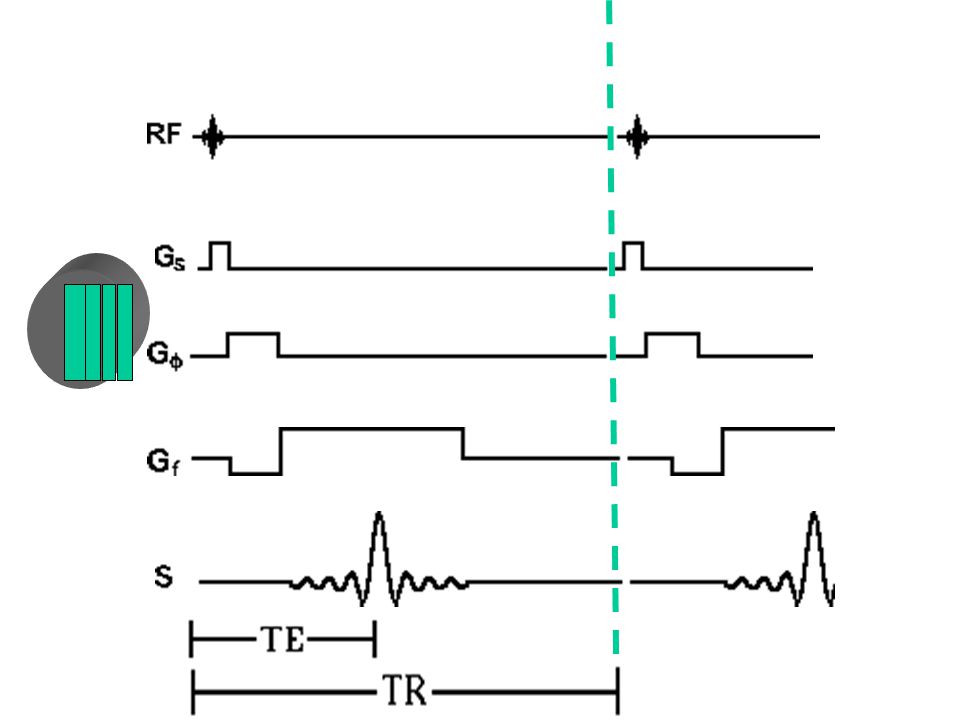
Spin Echo Imaging

83
Spin Echo Multiple Slice Imaging (SEMS) d1 can be short because each next scan is on a different slice.
 d1 can be short because each next scan is on a different slice.")
84
Spin Echo Multiple Slice Imaging (SEMS) Tss Tpe Tef=atTec Maximum slices per TR:
 Tss Tpe Tef=atTec Maximum slices per TR:")
96
TE (ms) TE (ms) 20 40 60 80 TR (ms) 250 500 750 1000 2000 Spin echo images
 TE (ms) TR (ms) Spin echo images")
97
Inversion-recovery imaging

98
Inversion-recovery imaging: slice selection

99
Inversion-recovery imaging

100
TR (s) 1 2 TI(ms) 50 100 250 500 750 Inversion-recovery images
 1 2 TI(ms) Inversion-recovery images")
101
Gradient recalled echo imaging

114
One additional gradient is applied between the 90o and 180o pulses. This gradient is along the same direction as the frequency encoding gradient. It dephases the spins so that they will rephase by the center of the echo. This gradient in effect prepares the signal to be at the edge of k-space by the start of the acquisition of the echo.

115
2

116
Gradient recalled echo imaging

117
Gradient recalled echo images (TE=5 ms) Θ(o) 15 30 45 60 90 TR (ms) 25 50 100 200
 Θ(o) TR (ms)")
120
Spin-Echo S = k r (1-exp(-TR/T1)) exp(-TE/T2) Inversion Recovery (180-90) S = k r (1-2exp(-TI/T1)+exp(-TR/T1)) Inversion Recovery (180-90-180) S = k r (1-2exp(-TI/T1)+exp(-TR/T1)) exp(-TE/T2) Gradient Recalled Echo S = k r (1-exp(-TR/T1)) Sinq exp(-TE/T2*) / (1 -Cosq exp(-TR/T1))
) exp(-TE/T2) Inversion Recovery (180-90) S = k r (1-2exp(-TI/T1)+exp(-TR/T1)) Inversion Recovery ( ) S = k r (1-2exp(-TI/T1)+exp(-TR/T1)) exp(-TE/T2) Gradient Recalled Echo S = k r (1-exp(-TR/T1)) Sinq exp(-TE/T2*) / (1 -Cosq exp(-TR/T1))")
121
Multiple Slice Imaging with Other Sequences Obviously, inversion-recovery, gradient recalled echo sequences can also be performed in multi-slice acquisition mode. Maximum slices per TR for gradient echo sequence: Maximum slices per TR for inversion-recovery sequence:

122
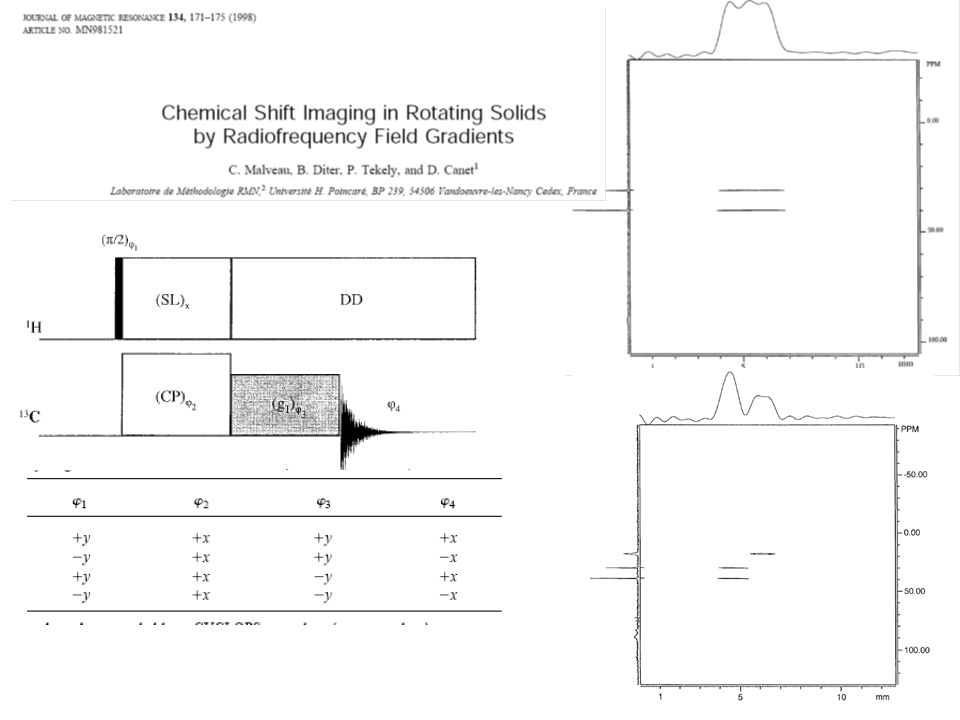
Chemical shift imaging (CSI)
")
124
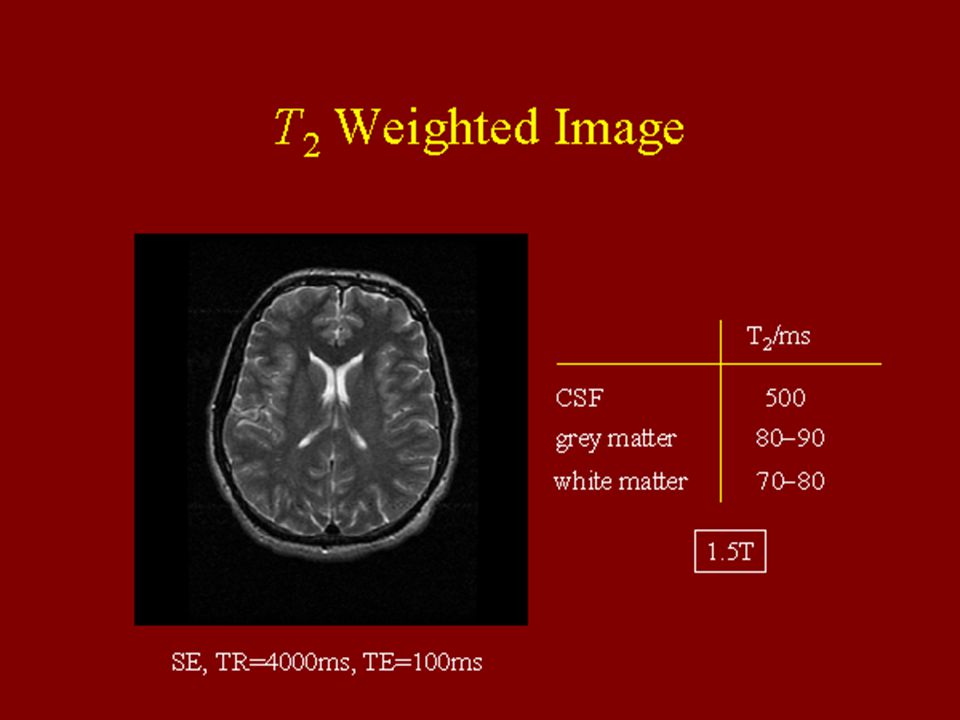
WeightingTR ValueTE Value T1T1 < = T 1 < < T 2 T2T2 > > T 1 > = T 2 > > T 1 < < T 2

125
Tissue T 1 (s) T 2 (ms) ** CSF0.8 - 20110 - 200070-230 White0.76 - 1.0861-10070-90 Gray1.09 - 2.1561 - 10985 - 125 Meninges0.5 - 2.250 - 1655 - 44 Muscle0.95 - 1.8220 - 6745 - 90 Adipose0.2 - 0.7553 - 9450 - 100 *Based on =111 for 12mM aqueous NiCl 2
 T 2 (ms) ** CSF White Gray Meninges Muscle Adipose *Based on =111 for 12mM aqueous NiCl 2")
133
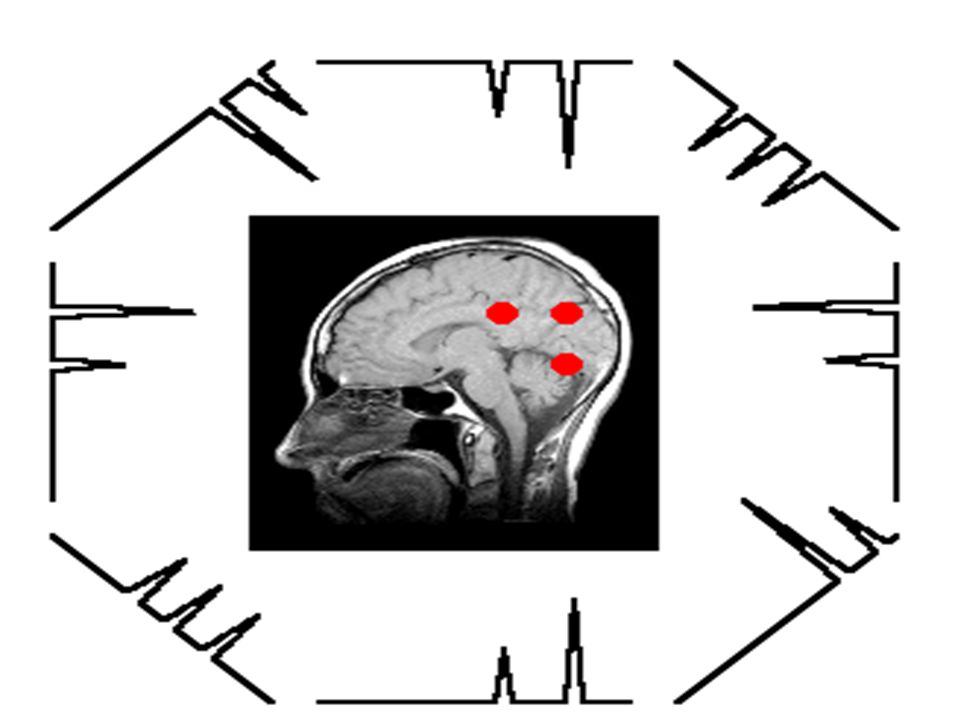
Activations (red–white color scale) and deactivations (blue–green color scale) in a group of 11 healthy elderly subjects during visual word encoding and retrieval (p 0.01, uncorrected). The Talairach coordinates of axial slices are indicated on the left-hand bottom of each image.

135
Concepts in Magnetic Resonance Part A, Vol. 16A(1) 35–49 (2003) Concepts in Magnetic Resonance Part A, Vol. 16A(1) 5–15 (2003)
 35–49 (2003) Concepts in Magnetic Resonance Part A, Vol. 16A(1) 5–15 (2003).")
136
Problems How many slices could you image with a 90-FID sequence which uses a 20 ms slice selection gradient, 10 ms phase encoding gradient, 100 ms frequency encoding gradient, and TR of 1 second? Draw a timing diagram for an inversion recovery imaging sequence which uses a 90-FID sequence rather than a spin-echo sequence to detect the signal present TI after the inversion (180 degree) pulse. There are two adjacent tissues in an image with a T2 of 30 and 50 ms. You wish to produce a spin-echo image of the tissues wuch that the contrast between the tissues is maximized. What TE should be used? You wish to image an oblique slice located at an angle of 45o to the +Z-axis and 45o to the +Y-axis. Since gradients can only be produced with the three gradient coil systems located around the x, y, and z-axes, what combination of the three gradients should be applied to produce a slice selection, phase encoding, and frequency encoding gradient? How many slices could you image with a gradient echo sequence that uses a 20 ms slice selection gradient, 10 ms phase encoding gradient, 10 ms dephasing frequency gradient, 100 ms frequency encoding gradient, and TR = 1 s? Draw a timing diagram for an inversion recovery imaging sequence which uses a gradient echo sequence rather than a spin-echo sequence to detect the signal present TI after the inversion (180 degree) pulse. There are two adjacent tissues in an image with T1a = 300 ms, T2a* = 20 ms, ra = 50 ASDU, and T1b = 150 ms, T2b* = 20 ms, rb = 50 ASDU. (ASDU = arbitrary spin density units.) You wish to produce a 90 o gradient echo image of the tissues such that the contrast between the tissues is maximized. What TR should be used? Assuming the standard magnetic coordinate system, what components of the gradients Gx, Gy, and Gz should be applied to create the gradients Gslice, Gphase, and Gfrequency for the following slice selection? A slice located 30o? away from the Z-axis and forming equal angles with the +X and +Y axes.
 pulse. There are two adjacent tissues in an image with a T2 of 30 and 50 ms. You wish to produce a spin-echo image of the tissues wuch that the contrast between the tissues is maximized. What TE should be used. You wish to image an oblique slice located at an angle of 45o to the +Z-axis and 45o to the +Y-axis. Since gradients can only be produced with the three gradient coil systems located around the x, y, and z-axes, what combination of the three gradients should be applied to produce a slice selection, phase encoding, and frequency encoding gradient. How many slices could you image with a gradient echo sequence that uses a 20 ms slice selection gradient, 10 ms phase encoding gradient, 10 ms dephasing frequency gradient, 100 ms frequency encoding gradient, and TR = 1 s. Draw a timing diagram for an inversion recovery imaging sequence which uses a gradient echo sequence rather than a spin-echo sequence to detect the signal present TI after the inversion (180 degree) pulse. There are two adjacent tissues in an image with T1a = 300 ms, T2a* = 20 ms, ra = 50 ASDU, and T1b = 150 ms, T2b* = 20 ms, rb = 50 ASDU. (ASDU = arbitrary spin density units.) You wish to produce a 90 o gradient echo image of the tissues such that the contrast between the tissues is maximized. What TR should be used. Assuming the standard magnetic coordinate system, what components of the gradients Gx, Gy, and Gz should be applied to create the gradients Gslice, Gphase, and Gfrequency for the following slice selection. A slice located 30o. away from the Z-axis and forming equal angles with the +X and +Y axes..")
137
Magnetic Resonance Microimaging (μMRI) The principle is basically the same as that of ordinary MRI. Sample size is in mm or smaller but resolution might be 10 times higher or more. Higher gradients are needed. Being at fast developing stage, with promise of single-spin imaging. A few challenges need to be addressed.

138
Microcoil is used (OD= 470 μm) Human hair (75 μm)
 Human hair (75 μm)")
139
For μNMR microcoil array and surface coils Surface coils Coil arrays 100 μm Human hair

140
Concepts in Magnetic Resonance, Vol. 13, 128, 2001. Concepts in Magnetic Resonance, Vol. 13, 190, 2001.

142
0.2 mm I.D. NMR microcoil (Full of de- ionized water) Copper wire 5.5 mm Top 1.625 mm 4.4 mm 1.4 mm 5.5 mm Side 2.45 mm 0.35 mm 0.625 mm The Gradient set holder Micro-Coil Gradient System
 Copper wire 5.5 mm Top mm 4.4 mm 1.4 mm 5.5 mm Side 2.45 mm 0.35 mm mm The Gradient set holder Micro-Coil Gradient System.")
143
Other magnetic resonance imaging techniques Magnetic force imaging Quantum imaging (single-spin imaging) Ferromagnetic resonance force imaging
 Ferromagnetic resonance force imaging")
148
Would MRI do these? Yes! We will make it!

Similar presentations