Download presentation
Presentation is loading. Please wait.

1
Hydrocarbon Emissions Detection & Remediation Project Josh McDowell Small Business Assistance Coordinator Department of Community Outreach

2
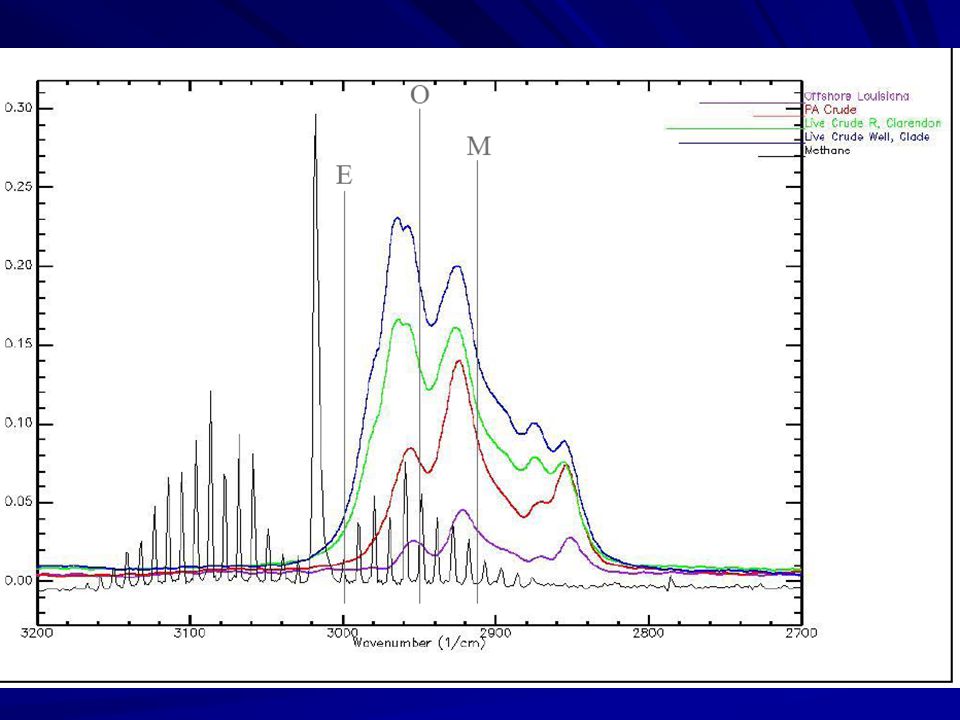
Methane CH 4

3
Methane Lewis Diagram

4
Methane Citi Bank Diagram

5
HEDR Two Goals 1. Beta Test ITT’s airborne LIDAR 2. Prove that vapor recovery is effective

6
ITT ANGEL System Airborne Natural Gas Emissions LIDAR Laser tuned to the absorption of natural gas

11
500 ft Altitude

12
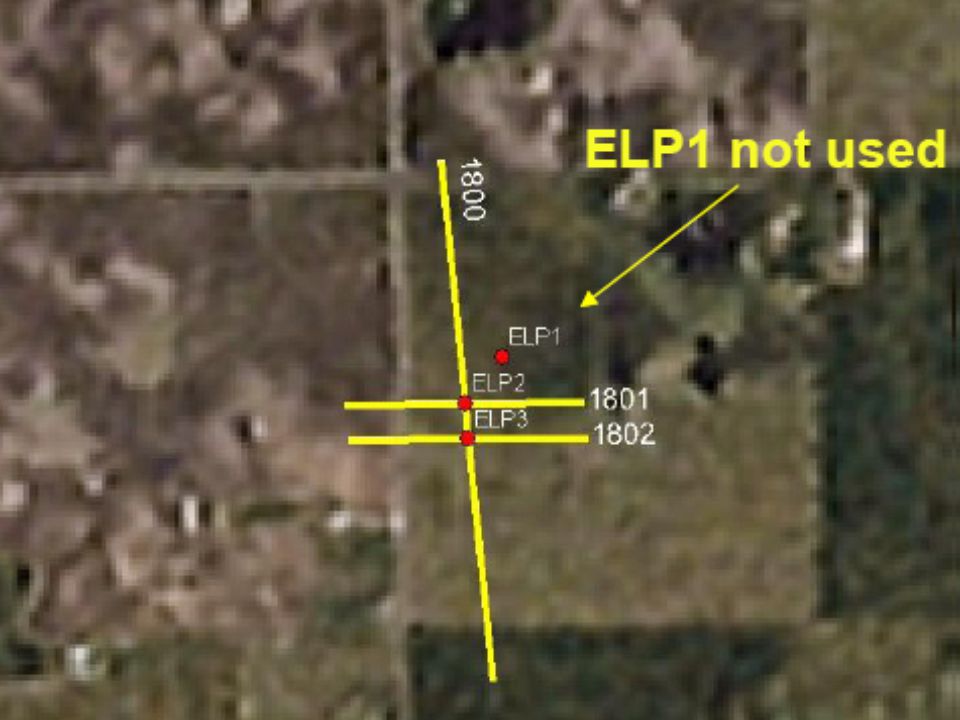
El Paso Production Site

13
Site Location South of South of Kingsville, TX

17
Two Passes

20
First Pass VRU Turned On

21
Second Pass VRU Turned Off

22
Point Source

23
How much is lost? The production sector accounts for 44% of the CH4 emissions in the oil and gas industry. Oil & Natural Gas Systems 26% Landfills 25% Other 19% Coal Mining 10% Enteric Fermentation 20% Inventory of U.S. Greenhouse Gas Emissions and Sinks 1990 – 2004, USEPA, April, 2006

24
Fugitive Emissions Estimated $2 Billion of Lost Revenue Source: EPA - Inventory of U.S. GHG Emissions and Sinks 1990 -2004

25
Three Main Sources Offshore Platforms Tank Batteries Gas Pneumatic Controls

26
What to do with vent gas? $6.00/Mcf

27
How to Limit Emissions & Make Money at the Same Time Vapor Recovery Plunger Lifts Compressed Air Controls

28
Why Vapor Recovery Even water can have dissolved gas in solution. This is mostly true for deeper wells (>10,000 ft.). Light volatiles from condensate can be captured (high Btu content). Crude oil can yield as much a $2 per bbl of vapor.
. Light volatiles from condensate can be captured (high Btu content). Crude oil can yield as much a $2 per bbl of vapor..")
29
Vapor Recovery Costs

30
Four Steps 1.Identify Possible Locations for VRU. 2. Quantify the Volume of Emissions. 3. Measure the Site. 4. Evaluate Cost Benefits.

31
Example With API Gravity of 38 o Separator Pressure = to 40 psi Production of 1000 bbl/day Vapor Emissions Rate = 43 Scf/bbl Total Vapor Captured = 43 Mcf per day Source: EPA

32
Why Plunger Lifts Plunger Lifts Limit Blowdown $ Limited Venting or Flaring

33
Plunger Lifts

34
Plunger Lift Benefits Revenue from Increased Production Avoid Title V Issues Fewer Workovers

35
Plunger Lift Evaluation

36
Plunger Lift Pay Back 14 Wells at Midland Farm Field, Texas Before Plunger Lift Total Production 2510 Mcfd 30 Days After Plunger Lift Installation Total Production 3869 Mcfd Source: World Oil, November 1995

37
Question If a 10,000’ well with a 8” casing and 214.7 psig shut-in pressure is vented weekly how much money is lost annually?

38
Answer $15,864Annually Cost of a plunger lift ≈ $8000

39
Ga $ Pneumatic Ca $ e $tudie $ How much are you losing? - Unocal Fresh Water Bayou Facility - After installing the compressed air controls increased throughput by 69,350 Mcf annually. $416,100 Source: EPA

40
Ga $ Pneumatic Ca $ e $tudie $ Conversion Project Cost $60,000

41
Ga $ Pneumatic Ca $ e $tudie $ In South Louisiana Chevron – Texaco converted 10 facilities to compressed air at a cost of $40,000. Annual payback at today’s prices $138,000

42
For More Information Useful Web Sites http://www.epa.gov/gasstar/ http://www.fe.doe.gov/index.html http://www.pttc.org/ http://www.icfi.com/Markets/Environment/

Similar presentations