Download presentation
Presentation is loading. Please wait.

1
A NEW EMISSION INVENTORY OF POWER PLANTS AND INDUSTRIAL FACILITIES IN THAILAND PHAM THI BICH THAO, KASEMSAN MANOMAIPHIBOON*, and CHATCHAWAN VONGMAHADLEK For Better Air Quality (BAQ) Conference Dec., 2006, Yogyakarta, Indonesia Joint Graduate School of Energy and Environment (JGSEE) King Mongkut’s University of Technology Thonburi (KMUTT) Bangkok, Thailand http://www.jgsee.kmutt.ac.th *Corresponding Author: kasemsan_m@jgsee.kmutt.ac.th
 Conference Dec., 2006, Yogyakarta, Indonesia Joint Graduate School of Energy and Environment (JGSEE) King Mongkut’s University of Technology Thonburi (KMUTT) Bangkok, Thailand *Corresponding Author:")
2
Emission Inventory INTRODUCTION A comprehensive listing by sources of air pollutant emissions in a geographic area during a specific time period Important and useful in air quality management, planning, as well as modeling Source: US EPA

3
Impact & Policy Assessment Environmental Strategy Policies Controls Environmental Goals Technical Feasibility Economic Issues Political Implications Environmental Impacts Human Health Ecosystem Economic Atmospheric Processes Pollutant Distributions Atmosphere Air Quality Management Cycle Emissions INTRODUCTION

4
Scope of Work Emissions covered: NOX, SO2, NMVOC, CO, NH3, OC, and BC Reason: To support air quality studies of ozone and fine particulate matter for Thailand Emission sources: EGAT, IPP, and SPP Onshore industrial facilities Base year: 2004 Domain: Entire Thailand INTRODUCTION Results shown here: Interim + Subject to double checking as part of QA process (ongoing)
")
5
Thailand & Its regions INTRODUCTION Region No. of Power Plants % No. of Industrial Facilities a % Central3631.047,03538.6 Eastern3933.68,5607.0 Northern1714.715,35812.6 Northeastern1311.241,16333.8 Southern119.59,8238.1 Source: Department of Industrial Works a) Excluding power plants
 Excluding power plants.")
6
General Approach where E: Emission rate [mass per time], EF uncontrolled : Emission factor without control technology [mass per activity unit], EF controlled : Emission factor with control technology [mass per activity unit], A: Activity rate [activity unit per time], and ER: Control efficiency (in percent) METHODOLOGY
![General Approach where E: Emission rate [mass per time], EF uncontrolled : Emission factor without control technology [mass per activity unit], EF controlled : Emission factor with control technology [mass per activity unit], A: Activity rate [activity unit per time], and ER: Control efficiency (in percent) METHODOLOGY](http://images.slideplayer.com/14/4216650/slides/slide_6.jpg "General Approach where E: Emission rate [mass per time], EF uncontrolled : Emission factor without control technology [mass per activity unit], EF controlled : Emission factor with control technology [mass per activity unit], A: Activity rate [activity unit per time], and ER: Control efficiency (in percent) METHODOLOGY")
7
Emission Estimation Diagram METHODOLOGY Fuel consumption (Source Specific) EGAT Power Plants IPP Top-down Bottom-up SPP Controlled EFs Fuel Consumption Uncontrolled EFs Semi Bottom-up Installed Capacity Uncontrolled EFs Annual Emission Estimates Industrial Facilities Top-down Industrial Production Uncontrolled EFs Industrial Facilities Energy Consumption Industrial Processes
 EGAT Power Plants IPP Top-down Bottom-up SPP Controlled EFs Fuel Consumption Uncontrolled EFs Semi Bottom-up Installed Capacity Uncontrolled EFs Annual Emission Estimates Industrial Facilities Top-down Industrial Production Uncontrolled EFs Industrial Facilities Energy Consumption Industrial Processes")
8
Emission Factors NOXSO2NMVOCCONH3BCOC Power Plants EGATAP-42 IPCCAP-42EIIP Cao et al. (2006) a IPPAP-42 IPCCAP-42EIIP SPPIPCCAP-42IPCC EIIP Industrial FacilitiesIPCCAP-42IPCC EIIP METHODOLOGY a)Cao et al (2006) Inventory of black carbon and organic carbon emissions from China. Atmospheric Environment 40, 6516-6527
 a IPPAP-42 IPCCAP-42EIIP SPPIPCCAP-42IPCC EIIP Industrial FacilitiesIPCCAP-42IPCC EIIP METHODOLOGY a)Cao et al (2006) Inventory of black carbon and organic carbon emissions from China. Atmospheric Environment 40,")
9
Emission control in EGAT and IPP: Low-NOX burner and water injection No emission control for CO & NMVOC No emission control in SPP & industrial facilities Average operation of industrial facilities: 48 hours/week METHODOLOGY Assumptions

10
Energy Consumption by TSIC a (in percent) METHODOLOGY a) Thai Standard Industrial Classification Source: Department of Alternative Energy Development and Efficiency
 METHODOLOGY a) Thai Standard Industrial Classification Source: Department of Alternative Energy Development and Efficiency")
11
Emission Estimates for Thermal Power Plants by Region RESULTS

13
Emission Estimates for Industrial Facilities by Region - Energy Consumption

14
RESULTS

15
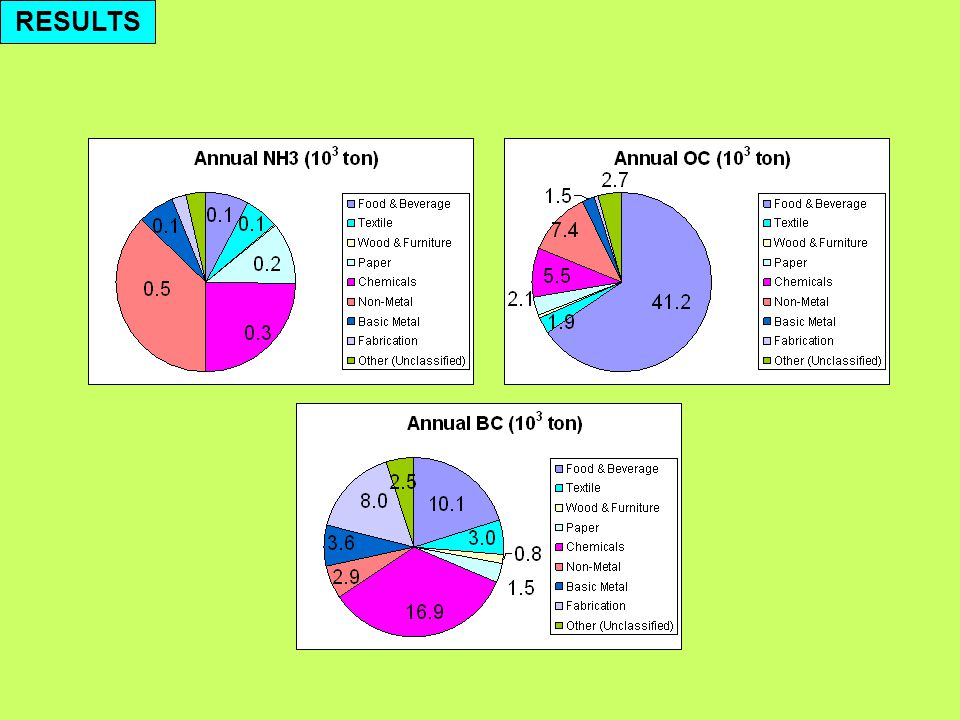
Emission Estimates for Industrial Facilities by TSIC - Energy Consumption RESULTS

17
Emission Estimates for Industrial Facilities by TSIC - Industrial Processes RESULTS SO2 (10 3 ton)273.2 NMVOC (10 3 ton)13.5 CO (10 3 ton)57.3
273.2 NMVOC (10 3 ton)13.5 CO (10 3 ton)57.3")
18
Comparison to Past Emission Inventories RESULTS This study (2004) TRACE-P (2000) JICA (2000) DEDE (2004) NOX (10 3 ton) 155.9207.1176.0413 SO2 (10 3 ton) 398.0888.8320357 CO (10 3 ton) 719.9NA 209
 TRACE-P (2000) JICA (2000) DEDE (2004) NOX (10 3 ton) SO2 (10 3 ton) CO (10 3 ton) 719.9NA 209")
19
Development of temporal distribution profiles of emission sources Spatial allocation Physical characterization of emission sources (e.g., stack parameters and locations) Ongoing Work
 Ongoing Work")
20
Acknowledgments Suthisa Sanguantrakool (Department of Alternative Energy Development and Efficiency) Piyavadee Limvoranusorn (Pollution Control Department) Dr. Sirakarn Leungsakul (Department of Industrial Works) Dr. Decha Pimpisut (Department of Industrial Works) Assoc. Prof. Dr. Prungchan Wongwises (JGSEE) Electricity Generating Authority of Thailand (EGAT) Joint Graduate School of Energy and Environment (JGSEE).
 Dr. Decha Pimpisut (Department of Industrial Works) Assoc. Prof. Dr. Prungchan Wongwises (JGSEE) Electricity Generating Authority of Thailand (EGAT) Joint Graduate School of Energy and Environment (JGSEE)..")
21
THANK YOU

Similar presentations


 North China Electric Power University July, 2010.>")


 1 STRUCTURE, STATUS AND CROSS BORDER POWER INTERCONNECTION 0F THAILAND b y Mr. Prutichai Chonglertvanichkul.>")
