Download presentation
Presentation is loading. Please wait.

2
Picture 2. Electrode artifact at O1. The morphology is very unusual for any cerebral waveform, and the distribution is limited to a single electrode.

3
Picture 3. Electrode artifact at F3. This should not me misinterpreted as a spike. This sharply contoured transient clearly occurs at only 1 electrode, as confirmed on the referential montage.

4
Picture 4. Ground recording artifact. This is a somewhat less common electrode artifact, also related to accidentally high impedance. The high impedance at T6 result in this electrode recording from the Ground on the forehead, thus picking up eye movements (which should normally not be seen at T6. )
.")
5
Picture 5. Just like electrode artifacts can simulate interictal spikes, they Can also mimic ictal pattern. This rhythmic artifact could be mistaken for An electrographic seizure, or SREDA (see normal variants). However, this is confined to a single electrode(T6), as could be confirmed on a referential montage. The fact that this artifactual will often be confirmed by the presence of other definite electrode “pops” in the same electrode.
. However, this is confined to a single electrode(T6), as could be confirmed on a referential montage. The fact that this artifactual will often be confirmed by the presence of other definite electrode pops in the same electrode..")
6
Picture 6. EMG (muscle) artifact best seen in the left temporal region. There is also EKG artifact, best seen in the posterior region.

7
Picture 7. EMG (muscle) artifact. These waveforms represent motor unit potentials as typically seen on needle electrode examination during EMG, with a frequency of 20-100 Hz. Distribution varies, and in this case it is more prominent on the left side. Such artifact can be diminished by the judicious use of the high frequency filter (this sample is with the default setting of HFF 70 Hz).
..")
8
Picture 8. Sweat artifact. This is characterized by very low frequency (here 0.25 to 0.5 Hz) oscillations. The distribution here (electrodes T3 and O1) suggests sweat on the left side. Note that morphology and frequency is Also consistent with slow rolling eye movements, but distribution is not.
 oscillations. The distribution here (electrodes T3 and O1) suggests sweat on the left side. Note that morphology and frequency is Also consistent with slow rolling eye movements, but distribution is not..")
9
Picture 9. Eye movements such as these are usually seen in frontal electrodes and not further posteriorly then mid temporal. The phase reversals at F7 and F8 are of opposite polarity, indicating lateral eye movements. Because the cornea is positively charged, and the retina negative, the side of the positivity indicates he direction of the eye movement. Thus, the first one here is to the right.

10
Picture 10. Electrode (impedance) artifact at P3. There is initially a slow artifact followed by a more abrupt one at the 7th second. This is commonly referred to as an “electrode pop.” Note again the unusual morphology of the sharp component, and the fact that it is at a single electrode. Also note an eye blink In the 3rd second, and slight EMG artifact in the frontal regions in the first 2 seconds.

11
Picture 11. Left frontal artifact in the 4th second. This is not limited to a single electrode and has the morphology of an eye movement, but is unilateral. This is an eye movement in a patient with has a glass eye on the left.

12
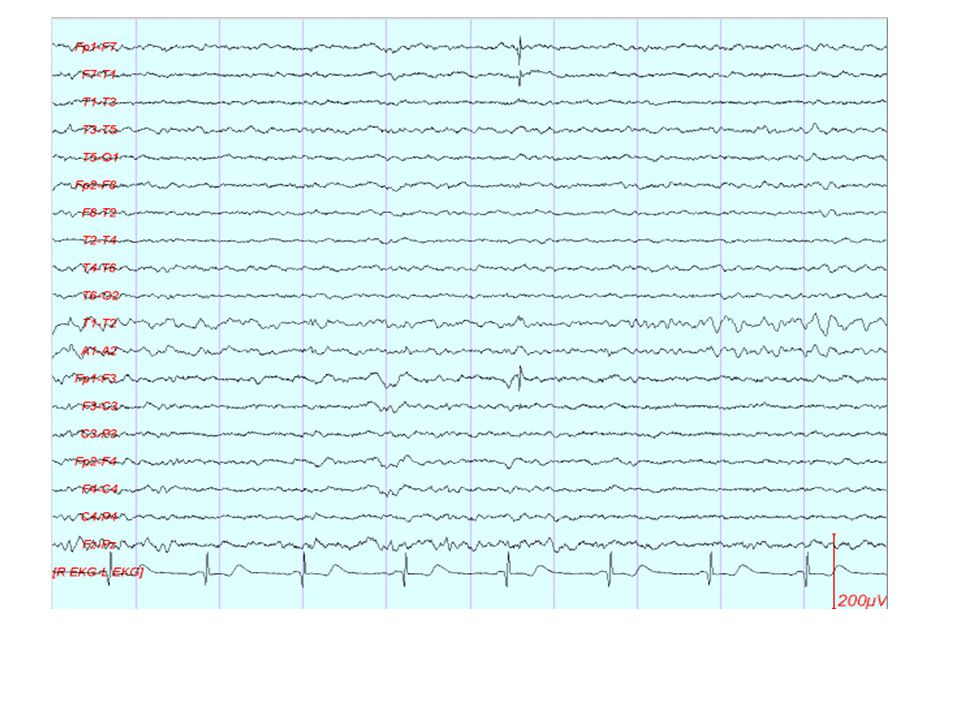
Picture 12. Regular (periodic) slow waves best seen at T4-T6 and T3-T5. These are clearly related to EKG. The duration and morphology are those of pulse artifact but (as shown by the marker) there is no delay between the EKG and the artifact. Thus this is an EKG artifact with broad QRS complexes.
 there is no delay between the EKG and the artifact. Thus this is an EKG artifact with broad QRS complexes..")
Similar presentations

 hardware/software.>")


 The only diagnostic test for absence seizures Ambulatory EEG monitoring over 24 hours may be useful to.>")

 machine records potential difference between.>")


