Download presentation
Presentation is loading. Please wait.

1
Limestone County 7 th Grade Math October 26, 2014 Jeanne Simpson AMSTI Math Specialist

2
Welcome Name School Classes you teach What do your students struggle to learn? 2

3
He who dares to teach must never cease to learn. John Cotton Dana 3

4
Goals for Today Implementation of the Standards of Mathematical Practices in daily lessons Understanding of what the CCRS expect students to learn blended with how they expect students to learn. Student-engaged learning around high- cognitive-demand tasks used in every classroom.

5
Agenda 7 th Grade Overview Teaching Strategies Activities Overview You Decide! 5

6
acos2010.wikispaces.com Electronic version of handouts Links to web resources

7
Major Work of Grade 7 7

8
Standards for Mathematical Practice Mathematically proficient students will: SMP1 - Make sense of problems and persevere in solving them SMP2 - Reason abstractly and quantitatively SMP3 - Construct viable arguments and critique the reasoning of others SMP4 - Model with mathematics SMP5 - Use appropriate tools strategically SMP6 - Attend to precision SMP7 - Look for and make use of structure SMP8 - Look for and express regularity in repeated reasoning 8

9
Students:(I) Initial(IN) Intermediate(A)Advanced 1a Make sense of problems Explain their thought processes in solving a problem one way. Explain their thought processes in solving a problem and representing it in several ways. Discuss, explain, and demonstrate solving a problem with multiple representations and in multiple ways. 1b Persevere in solving them Stay with a challenging problem for more than one attempt. Try several approaches in finding a solution, and only seek hints if stuck. Struggle with various attempts over time, and learn from previous solution attempts. 2 Reason abstractly and quantitatively Reason with models or pictorial representations to solve problems. Are able to translate situations into symbols for solving problems. Convert situations into symbols to appropriately solve problems as well as convert symbols into meaningful situations. 3a Construct viable arguments Explain their thinking for the solution they found. Explain their own thinking and thinking of others with accurate vocabulary. Justify and explain, with accurate language and vocabulary, why their solution is correct. 3b Critique the reasoning of others. Understand and discuss other ideas and approaches. Explain other students’ solutions and identify strengths and weaknesses of the solution. Compare and contrast various solution strategies and explain the reasoning of others. 4 Model with Mathematics Use models to represent and solve a problem, and translate the solution to mathematical symbols. Use models and symbols to represent and solve a problem, and accurately explain the solution representation. Use a variety of models, symbolic representations, and technology tools to demonstrate a solution to a problem. 5 Use appropriate tools strategically Use the appropriate tool to find a solution. Select from a variety of tools the ones that can be used to solve a problem, and explain their reasoning for the selection. Combine various tools, including technology, explore and solve a problem as well as justify their tool selection and problem solution. 6 Attend to precision Communicate their reasoning and solution to others. Incorporate appropriate vocabulary and symbols when communicating with others. Use appropriate symbols, vocabulary, and labeling to effectively communicate and exchange ideas. 7 Look for and make use of structure Look for structure within mathematics to help them solve problems efficiently (such as 2 x 7 x 5 has the same value as 2 x 5 x 7, so instead of multiplying 14 x 5, which is (2 x 7) x 5, the student can mentally calculate 10 x 7. Compose and decompose number situations and relationships through observed patterns in order to simplify solutions. See complex and complicated mathematical expressions as component parts. 8Look for and express regularity in repeated reasoning Look for obvious patterns, and use if/ then reasoning strategies for obvious patterns. Find and explain subtle patterns. Discover deep, underlying relationships, i.e. uncover a model or equation that unifies the various aspects of a problem such as discovering an underlying function. SMP Proficiency Matrix
 x 5, the student can mentally calculate 10 x 7. Compose and decompose number situations and relationships through observed patterns in order to simplify solutions. See complex and complicated mathematical expressions as component parts. 8Look for and express regularity in repeated reasoning Look for obvious patterns, and use if/ then reasoning strategies for obvious patterns. Find and explain subtle patterns. Discover deep, underlying relationships, i.e. uncover a model or equation that unifies the various aspects of a problem such as discovering an underlying function. SMP Proficiency Matrix.")
10
SMP Instructional Implementation Sequence 1. Think-Pair-Share (1, 3) 2. Showing thinking in classrooms (3, 6) 3. Questioning and wait time (1, 3) 4. Grouping and engaging problems (1, 2, 3, 4, 5, 8) 5. Using questions and prompts with groups (4, 7) 6. Allowing students to struggle (1, 4, 5, 6, 7, 8) 7. Encouraging reasoning (2, 6, 7, 8)
 3. Questioning and wait time (1, 3) 4. Grouping and engaging problems (1, 2, 3, 4, 5, 8) 5. Using questions and prompts with groups (4, 7) 6. Allowing students to struggle (1, 4, 5, 6, 7, 8) 7. Encouraging reasoning (2, 6, 7, 8).")
11
Students:(I) Initial(IN) Intermediate(A)Advanced 1a Make sense of problems Explain their thought processes in solving a problem one way. Explain their thought processes in solving a problem and representing it in several ways. Discuss, explain, and demonstrate solving a problem with multiple representations and in multiple ways. 1b Persevere in solving them Stay with a challenging problem for more than one attempt. Try several approaches in finding a solution, and only seek hints if stuck. Struggle with various attempts over time, and learn from previous solution attempts. 2 Reason abstractly and quantitatively Reason with models or pictorial representations to solve problems. Are able to translate situations into symbols for solving problems. Convert situations into symbols to appropriately solve problems as well as convert symbols into meaningful situations. 3a Construct viable arguments Explain their thinking for the solution they found. Explain their own thinking and thinking of others with accurate vocabulary. Justify and explain, with accurate language and vocabulary, why their solution is correct. 3b Critique the reasoning of others. Understand and discuss other ideas and approaches. Explain other students’ solutions and identify strengths and weaknesses of the solution. Compare and contrast various solution strategies and explain the reasoning of others. 4 Model with Mathematics Use models to represent and solve a problem, and translate the solution to mathematical symbols. Use models and symbols to represent and solve a problem, and accurately explain the solution representation. Use a variety of models, symbolic representations, and technology tools to demonstrate a solution to a problem. 5 Use appropriate tools strategically Use the appropriate tool to find a solution. Select from a variety of tools the ones that can be used to solve a problem, and explain their reasoning for the selection. Combine various tools, including technology, explore and solve a problem as well as justify their tool selection and problem solution. 6 Attend to precision Communicate their reasoning and solution to others. Incorporate appropriate vocabulary and symbols when communicating with others. Use appropriate symbols, vocabulary, and labeling to effectively communicate and exchange ideas. 7 Look for and make use of structure Look for structure within mathematics to help them solve problems efficiently (such as 2 x 7 x 5 has the same value as 2 x 5 x 7, so instead of multiplying 14 x 5, which is (2 x 7) x 5, the student can mentally calculate 10 x 7. Compose and decompose number situations and relationships through observed patterns in order to simplify solutions. See complex and complicated mathematical expressions as component parts. 8Look for and express regularity in repeated reasoning Look for obvious patterns, and use if/ then reasoning strategies for obvious patterns. Find and explain subtle patterns. Discover deep, underlying relationships, i.e. uncover a model or equation that unifies the various aspects of a problem such as discovering an underlying function. SMP Proficiency Matrix Grouping/Engaging Problems Pair-Share Showing Thinking Questioning/Wait Time Questions/Prompts for Groups Pair-Share Grouping/Engaging Problems Questioning/Wait Time Grouping/Engaging Problems Allowing Struggle Grouping/Engaging Problems Showing Thinking Encourage Reasoning Grouping/Engaging Problems Showing Thinking Encourage Reasoning
 x 5, the student can mentally calculate 10 x 7. Compose and decompose number situations and relationships through observed patterns in order to simplify solutions. See complex and complicated mathematical expressions as component parts. 8Look for and express regularity in repeated reasoning Look for obvious patterns, and use if/ then reasoning strategies for obvious patterns. Find and explain subtle patterns. Discover deep, underlying relationships, i.e. uncover a model or equation that unifies the various aspects of a problem such as discovering an underlying function. SMP Proficiency Matrix Grouping/Engaging Problems Pair-Share Showing Thinking Questioning/Wait Time Questions/Prompts for Groups Pair-Share Grouping/Engaging Problems Questioning/Wait Time Grouping/Engaging Problems Allowing Struggle Grouping/Engaging Problems Showing Thinking Encourage Reasoning Grouping/Engaging Problems Showing Thinking Encourage Reasoning.")
13
13

14
Ratios and Proportional Relationships 14

15
Analyze proportional relationships and use them to solve real-world and mathematical problems. 7.RP.2. Recognize and represent proportional relationships between quantities. a. Decide whether two quantities are in a proportional relationship, e.g., by testing for equivalent ratios in a table or graphing on a coordinate plane and observing whether the graph is a straight line through the origin. b. Identify the constant of proportionality (unit rate) in tables, graphs, equations, diagrams, and verbal descriptions of proportional relationships. c. Represent proportional relationships by equations. d. Explain what a point (x, y) on the graph of a proportional relationship means in terms of the situation, with special attention to the points (0, 0) and (1, r) where r is the unit rate. 15
 in tables, graphs, equations, diagrams, and verbal descriptions of proportional relationships. c. Represent proportional relationships by equations. d. Explain what a point (x, y) on the graph of a proportional relationship means in terms of the situation, with special attention to the points (0, 0) and (1, r) where r is the unit rate. 15.")
16
Solving Proportions Solve The traditional method of creating and solving proportions by using cross-multiplication is de- emphasized (in fact it is not mentioned in the CCSS) because it obscures the proportional relationship between quantities in a given problem situation. Kanold, p. 94 If two pounds of beans cost $5, how much will 15 pounds of beans cost? 16

17
Implications for Instruction Proportional reasoning is complex and needs to be developed over a long period of time. The study of ratios and proportions should not be a single unit but a unifying theme throughout the middle school curriculum. Students need time to explore a variety of multiplicative situations, to coordinate both additive and relative perspectives, to experience unitizing, and to explore informally the nature of ratio in different problem contexts. Instruction should begin with physical experiments and situations that can be visualized and modeled. The cross-product rule should be delayed until students understand and are proficient with informal and quantitative methods for solving proportion problems.

18
Proportional Relationship Activities Teaching Channel Video Teaching Channel Video MARS Lesson– Understanding Proportional Relationships (featured in video) MARS Lesson– Understanding Proportional Relationships (featured in video) EngageNY Lesson – Identifying Proportional and Non-Proportional Relationships in Graphs EngageNY Lesson – Identifying Proportional and Non-Proportional Relationships in Graphs 18
 MARS Lesson– Understanding Proportional Relationships (featured in video) EngageNY Lesson – Identifying Proportional and Non-Proportional Relationships in Graphs EngageNY Lesson – Identifying Proportional and Non-Proportional Relationships in Graphs 18")
19
Teaching Channel Video 19

20
Proportion and Non-Proportion SituationsProjector Resources Buying Cheese 10 ounces of cheese costs $2.40 Ross wants to buy ……… ounces of cheese. Ross will have to pay $......... P-20

21
Proportion and Non-Proportion SituationsProjector Resources Properties of Direct Proportion One quantity is a multiple of the other. If the first quantity is zero, the second quantity is zero. If you double one quantity, the other also doubles. The graph of the relationship, is a straight line through the origin. P-21

22
Proportion and Non-Proportion SituationsProjector Resources Working Together Choose one of the cards to work on together. 1. Choose some easy numbers to fill in the blanks. Answer the question you have written. Write all your reasoning on the card. 2.Now choose harder numbers to fill in the blanks. Answer your new question together. Write all your reasoning on the card. 3.Decide whether the quantities vary in direct proportion. Write your answer and your reasoning on the card. When you have finished one card, choose another. P-22

23
Proportion and Non-Proportion SituationsProjector Resources Analyzing Each Other’s Work Carefully read each solution in turn. Is there anything you don’t understand? Do you notice any errors? Compare the work to your own solution to the question. Have you used the same methods? Do you have the same numerical answers? Do you agree about which question involves direct proportion? P-23

24
Proportion and Non-Proportion SituationsProjector Resources Driving P-24 If I drive at.… miles per hour, my journey will take …. hours. How long will my journey take if I drive at …. miles per hour?

25
Proportion and Non-Proportion SituationsProjector Resources Internet P-25 An internet service provides.... GB (gigabites) free each month. Extra GB used is charged at $..... per GB. I used..... GB last month. How much did this cost?
 free each month. Extra GB used is charged at $..... per GB. I used..... GB last month. How much did this cost .")
26
Proportion and Non-Proportion SituationsProjector Resources Cell Phone P-26 A cell phone company charges $... per month plus $.... per call minute. I used.… call minutes last month. How much did this cost?

27
Proportion and Non-Proportion SituationsProjector Resources Map P-27 A road.… inches long on a map is.… miles long in real life. A river is.… inches long on the map. How long is the river in real life?

28
Proportion and Non-Proportion SituationsProjector Resources Toast P-28

29
Proportion and Non-Proportion SituationsProjector Resources Smoothie P-29 To make three strawberry smoothies, you need:.… cups of apple juice …. bananas.… cups of strawberries How many bananas are needed for …. smoothies?

30
Proportion and Non-Proportion SituationsProjector Resources Triangles P-30

31
Proportion and Non-Proportion SituationsProjector Resources Line P-31

32
Proportion and Non-Proportion SituationsProjector Resources Proportion or not? P-32 What situations would give graphs like these? Which are proportional situations? OOO

33
Identifying Proportional and Non- Proportional Relationships in Graphs 33

34
The Number System 34

35
Mathematics consists of pieces that make sense; they are not just independent manipulation/skills to be practiced and memorized – as perceived by many students. These individual pieces progress through different grades (in organized structures we called “flows”) and can/should be unified together into a coherent whole. Jason Zimba, Bill McCallum 35
 and can/should be unified together into a coherent whole. Jason Zimba, Bill McCallum 35.")
36
7NS - Understanding 7.NS.1b – Understand p + q as the number located a distance |q| from p, in the positive or negative direction depending on whether q is positive or negative. 7.NS.1c – Understand subtraction of rational numbers as adding the additive inverse, p – q = p + (–q). 7.NS.2a – Understand that multiplication is extended from fractions to rational numbers by requiring that operations continue to satisfy the properties of operations, particularly the distributive property, leading to products such as (–1)(–1) = 1 and the rules for multiplying signed numbers. 7.NS.2b – Understand that integers can be divided, provided that the divisor is not zero, and every quotient of integers (with nonzero divisor) is a rational number. 36
. 7.NS.2a – Understand that multiplication is extended from fractions to rational numbers by requiring that operations continue to satisfy the properties of operations, particularly the distributive property, leading to products such as (–1)(–1) = 1 and the rules for multiplying signed numbers. 7.NS.2b – Understand that integers can be divided, provided that the divisor is not zero, and every quotient of integers (with nonzero divisor) is a rational number. 36.")
37
K–6 Geometry 6-8 Statistics and Probability 6–7 Ratios and Proportional Relationships 6–8 Expressions and Equations 6-8 Number Systems 3-5 Number and Operations: Fractions These are the documents currently available. They are working on documents for the other domains (Functions, Geometry 7-8). Progressions Documents http://ime.math.arizona.edu/progressions/
. Progressions Documents")
38
Adding Integers 38

39
Opposites 39

40
Subtracting Integers 40

41
Subtracting Integers 41

42
Expressions and Equations 42

43
Apply properties of operations as strategies to add, subtract, factor, and expand linear expressions with rational coefficients. (7.EE.7) Understand that rewriting an expression in different forms in a problem context can shed light on the problem, and how the quantities in it are related. (7.EE.8) Solve multistep real-life and mathematical problems posed with positive and negative rational numbers in any form (whole numbers, fractions, and decimals), using tools strategically. Apply properties of operations to calculate with numbers in any form, convert between forms as appropriate, and assess the reasonableness of answers using mental computation and estimation strategies. (7.EE.9) 43
 Understand that rewriting an expression in different forms in a problem context can shed light on the problem, and how the quantities in it are related. (7.EE.8) Solve multistep real-life and mathematical problems posed with positive and negative rational numbers in any form (whole numbers, fractions, and decimals), using tools strategically. Apply properties of operations to calculate with numbers in any form, convert between forms as appropriate, and assess the reasonableness of answers using mental computation and estimation strategies. (7.EE.9) 43.")
44
Fluency Expectations 44 GradeRequired Fluency KAdd/subtract within 5 1Add/subtract within 10 2Add/subtract within 20 Add/subtract within 100 (pencil and paper) 3Multiply/divide within 100 Add/subtract within 1000 4Add/subtract within 1,000,000 5Multi-digit multiplication 6Multi-digit division (6.NS.2) Multi-digit decimal operations (6.NS.3) 7Solve px + q = r, p(x + q) = r
 3Multiply/divide within 100 Add/subtract within Add/subtract within 1,000,000 5Multi-digit multiplication 6Multi-digit division (6.NS.2) Multi-digit decimal operations (6.NS.3) 7Solve px + q = r, p(x + q) = r")
45
Illustrative Mathematics 45 Illustrative Mathematics provides guidance to states, assessment consortia, testing companies, and curriculum developers by illustrating the range and types of mathematical work that students experience in a faithful implementation of the Common Core State Standards, and by publishing other tools that support implementation of the standards. http://www.illustrativemathematics.org/

46
Who is the Better Batter? P-46 Below is a table showing the number of hits and the number of times at bat for two Major League Baseball players during two different season: a. For each season, find the players’ batting averages. Who has better batting average? b. For the combined 1995 and 1996 seasons, find the players’ batting averages. Who has the better batting average? c. Are the answers to (a) and (b) consistent? Explain. SeasonDerek JeterDavid Justice 199512 hits in 48 at bats104 hits in 411 at bats 1996183 hits in 582 at bats45 hits in 140 at bats
 and (b) consistent. Explain. SeasonDerek JeterDavid Justice hits in 48 at bats104 hits in 411 at bats hits in 582 at bats45 hits in 140 at bats.")
47
Shrinking Catrina read that a woman over the age of 40 can lose approximately 0.06 centimeters of height per year. a. Catrina’s aunt Nancy is 40 years old and is 5 feet 7 inches tall. Assuming her height decreases at this rate after the age of 40, about how tall will she be at age 65? (Remember that 1 inch = 2.54 centimeters.) b. Catrina’s 90-year-old grandmother is 5 feet 1 inch tall. Assuming her grandmother’s height had also decreased at this rate, about how tall was she at age 40?
 b. Catrina’s 90-year-old grandmother is 5 feet 1 inch tall. Assuming her grandmother’s height had also decreased at this rate, about how tall was she at age 40 .")
48
Gotham City Taxis

49
Number Tricks Phone Number Trick The Three Swap The Corner Kick The Lefty No-Looker The Short Sleeves The Dusty Handshake

50
Geometry 50

51
7.G.2 - Draw (freehand, with ruler and protractor, and with technology) geometric shapes with given conditions. Focus on constructing triangles from three measures of angles or sides, noticing when the conditions determine a unique triangle, more than one triangle, or no triangle. 51

52
Triangular Frameworks 52

53
Possible Triangular Constructions 53

54
7.G.3 - Describe the two- dimensional figures that result from slicing three-dimensional figures, as in plane sections of right rectangular prisms and right rectangular pyramids. 54

55
7.G.4 - Know the formulas for the area and circumference of a circle, and use them to solve problems; give an informal derivation of the relationship between the circumference and area of a circle. 55

56
Slicing Pi

57
“S QUARING ” A C IRCLE

58
Labsheet 7.4 shows three circles. A portion of each circle is covered by a shaded square. What do you notice about the side lengths of the squares?

59
D IRECTIONS Each person in your group will cut out one circle. Cut squares (one from each color) the size of the square on your circle. Find out how many “radius squares” it takes to cover your circle. Record your group’s data in a table Circle Radius of Area of Area of Number of radius circle radius circle squares needed square
 the size of the square on your circle. Find out how many radius squares it takes to cover your circle. Record your group’s data in a table Circle Radius of Area of Area of Number of radius circle radius circle squares needed square.")
60
S UMMARY What patterns do you see in your data? If you were asked to estimate the area of any circle in “radius squares,” what would it be? How can you find the area of a circle if you know the diameter or the radius? How can you find the diameter or radius of a circle if you know the area?

61
Volume and Surface Area

62
7.G.6 – Solve real-world and mathematical problems involving area, volume, and surface area of two- and three-dimensional objects composed of triangles, quadrilaterals, polygons, cubes, and right prisms.

63
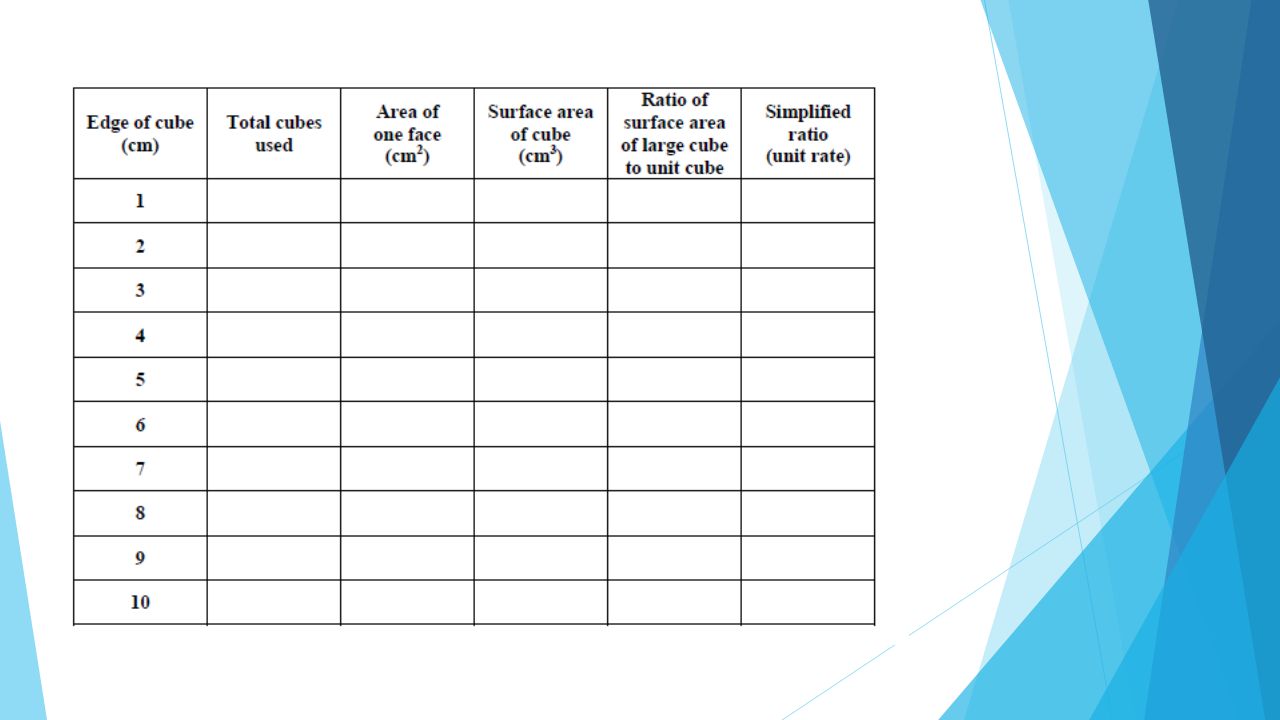
Changing Surface Area I can solve real-world problems involving surface area of cubes. I can draw a model for a proportional relationship. I can compute unit rate.

64
Before we begin… How do we calculate the area of a square? What are the faces of a three dimensional figure? What is meant by the term unit rate? How would you describe the surface area of a figure?

65
Changing Surface Area

66
Changing Surface Areas

69
Statistics and Probability 69

70
Draw informal comparative inferences about two populations. 7.SP.3 Informally assess the degree of visual overlap of two numerical data distributions with similar variabilities, measuring the difference between the centers by expressing it as a multiple of a measure of variability. 70

71
How MAD are You? (Mean Absolute Deviation) Fist to Five…How much do you know about Mean Absolute Deviation? 0 = No Knowledge 5 = Master Knowledge
 Fist to Five…How much do you know about Mean Absolute Deviation. 0 = No Knowledge 5 = Master Knowledge.")
72
Create a distribution of nine data points on your number line that would yield a mean of 5.

73
Card Sort Which data set seems to differ the least from the mean? Which data set seems to differ the most from the mean? Put all of the data sets in order from “Differs Least” from the mean to “Differs Most” from the mean.

74
The mean in each set equals 5. 3 3 3 3 2 1 1 4 6 Find the distance (deviation) of each point from the mean. Use the absolute value of each distance. Find the mean of the absolute deviations.
 of each point from the mean. Use the absolute value of each distance. Find the mean of the absolute deviations..")
75
How could we arrange the nine points in our data to decrease the MAD? How could we arrange the nine points in our data to increase the MAD? How MAD are you?

76
Offensive Linemen 76

77
Jeanne Simpson UAHuntsville AMSTI jeanne.simpson@uah.edu acos2010@wikispaces.com Contact Information 77

Similar presentations


 Welcome to your child’s 6 th Grade Math Class On Team (6B) Where we try to make sense of numbers.>")

>")

 − 2(7 − 2x) Example:>")

