Download presentation
Presentation is loading. Please wait.

1
V.R. Eaton High School Attendance Boundary November 18, 2013

2
Sept 01 5,641 268 5% Sept 02 6,199 558 9% Sept 04 7,595 704 10% Sept 05 8,678 1,083 14% Sept 06 10,354 1,676 19% Sept 03 6,891 692 11% Sept 07 11,804 1,459 14% Sept 08 13,026 1,222 11% Sept 09 14,100 1,074 8.5% Sept 10 15,400 1,300 9% Sept 11 16,600 1,200 8% Sept 12 17,800 1,200 7.3% NISD Growth History Sept 00 5,373 September 2017 projected enrollment 25,000 students Sept 13 19,001 1,200 6.7%

3
What’s in the Future For the Current School Attendance Zones

4
100 Students 4,016 Students 752 Students 209 Students 105 Students 160 Students 205 Students 15 Students 38 Students 20 Students 19 Students 0 Student 2 Students 0 Student 2001-02 Enrollment- 5,641

5
9,066 Students 2,740 Students 2,251 Students 1,271 Students 2001-02 Enrollment- 5,641 2012-13 Enrollment 17,800

6
1 2 3 4 5 6 7 9 8 10 11 12 13 14 1615 17 18 19 20 21 22 23 24 25 26 27 28 29 30 31 32 34 33 35 36 37 39 38 40 41 42 43 44 45 46 47 48 49 50 51 Northwest Independent School District 2012 Development Map

7
Development Elementary Attendance Zone 2009-10 Rank 1.Highlands of TC Beck Elementary Unranked 2.Sendera Ranch Thompson Elementary 1 3.Highlands of TC Lakeview Elementary Unranked 4.Rivers Edge Hatfield Elementary Unranked 5.Harmon Ranch Peterson Elementary Unranked 6.Briarwyck Roanoke Elementary 4 7.Turnberry Lakeview Elementary Unranked 8.Tehama Ridge Peterson Elementary 6 9.Sendera Ranch Sendera Ranch Elementary 1 10.Trails of Fossil Creek Nance Elementary Unranked Top 10 Developments In 2012

8
Boundary Review Boundary Change History August 2002- Realigned all elementary school attendance zones 2002- Placed Chisholm Creek in Seven Hills attendance zone 2003- Placed Sendera Ranch in Prairie View attendance zone 2002 & 2004 Property Exchange with Keller ISD March 2005- Established Hughes and Nance Elementary School Attendance Boundaries March 2006- Established Granger Elementary School Attendance Boundaries November 2007- Established boundaries for Byron Nelson High School March 2008- Established Boundaries for Sendera Ranch Elementary School and O.A. Peterson Elementary School March 2009- Established boundaries for Clara Love Elementary School, Justin Elementary School, and Hatfield Elementary School January 2010- Established boundaries for Tidwell Middle School March 2011- Established boundaries for Schluter Elementary School March 2011- Established boundaries for Thompson Elementary School November 2011- Established boundaries for Wilson Middle School 2013- Established boundaries for Cox Elementary School 2013- Revised the attendance boundaries between Granger Elementary School and Hughes Elementary School 2013- Revised the attendance boundaries between Hatfield Elementary School and Love Elementary School

9
Develop Long Range Boundary Strategies Establish Attendance Boundaries Improve Efficiency of Schools Minimize Future Changes Purpose of Boundary Recommendations

10
Review District Needs Review Growth Projections Establish Tentative Boundaries Review with Communities Make Recommendation to the School Board Boundaries Established by the School Board Basic Steps for Boundary Development

11
Northwest High School- Projections 2014-152,890 2015-163,109 2016-173,335 2017-183,499 2018-193,691 2019-203,866 Byron Nelson High School- Projections 2014-152,399 2015-162,552 2016-172,670 2017-182,960 2018-193,246 2019-203,510 Current High School Boundaries Please note the enrollment projections are based on the actual 2013-14 enrollment and do not reflect the impact of the academies Northwest High School Byron Nelson High School

12
Northwest High School- Projections 2014-152,890 2015-162,256 2016-172,127 2017-182,200 2018-192,354 2019-202,518 Byron Nelson High School- Projections 2014-152,399 2015-162,371 2016-172,251 2017-182,231 2018-192,365 2019-202,483 V.R. Eaton High School- Projections 2014-15 0 2015-161,035 2016-171,627 2017-182,029 2018-192,219 2019-202,374 Proposed High School Boundaries Please note the enrollment projections are based on the actual 2013-14 enrollment and do not reflect the impact of the academies Northwest High School Byron Nelson High School V.R. Eaton High School

14
May 2013 October 2013

15
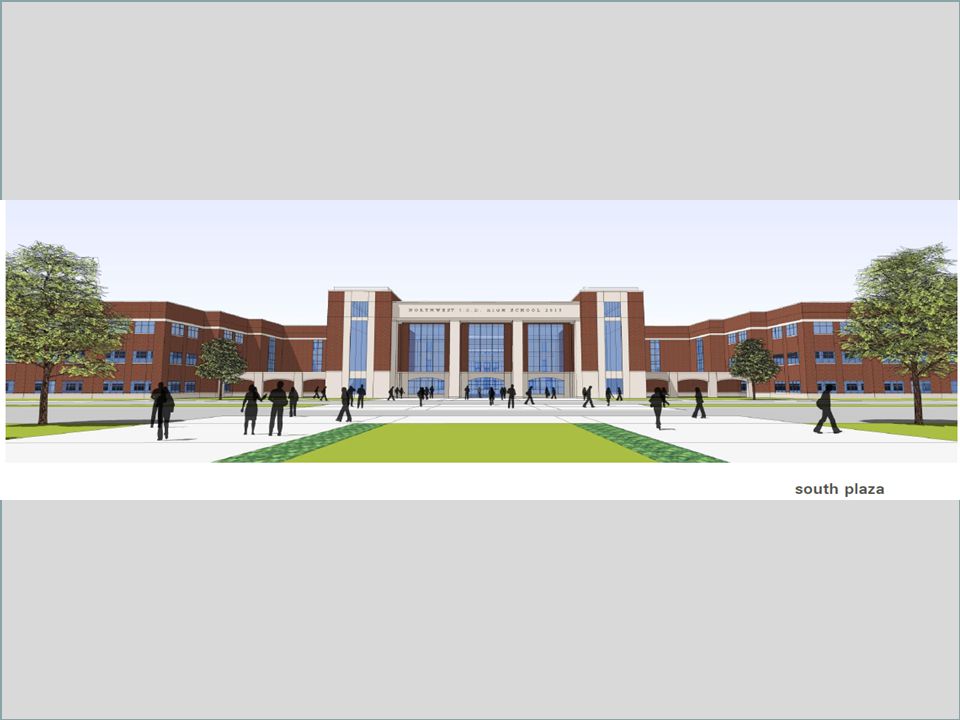
Schluter Elementary site

Similar presentations


! Open Enrollment Process.>")


 Program Update Presented to the Board of Trustees By Maria Wetzel, Assistant Superintendent Nora Guerra, Director of.>")


