Download presentation
Presentation is loading. Please wait.

1
Climate Change: Past, Present and Future

2
Warm up: 1.Sketch a graph (Global Temperature vs. Time) for the past 20,000 years and predict how climate has changed 2.Predict two reasons as to why climate change has occurred
 for the past 20,000 years and predict how climate has changed 2.Predict two reasons as to why climate change has occurred.")
3
The Climate is Always Changing

4
How does the Climate Change? Seasonal fluctuations are due to the tilt of the Earth

5
The regions tilted towards the sun are warmed more, so they experience a summer. Regions at the equator are exposed to the same amount of sun yearly, so they do not experience the four seasons

6
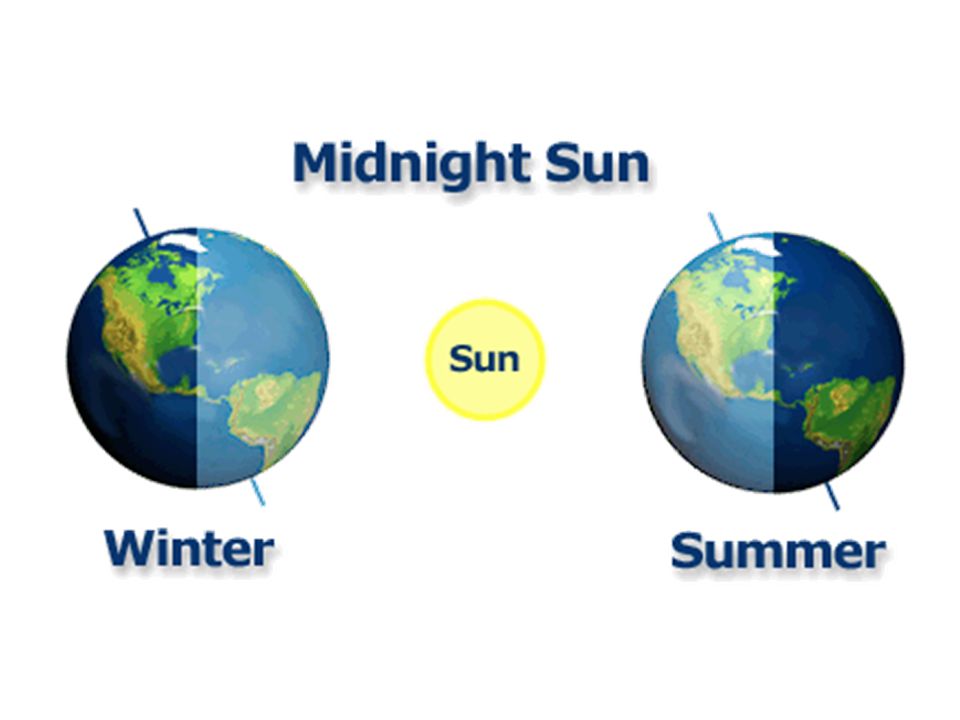
The Midnight Sun Because the Earth is tilted 22.5 degrees, in some seasons, Earth’s polar regions are exposed to the sun’s light 24-hours per day. This is called the “The Midnight Sun” http://www.youtube.com/watch?v=ndlQNicOes o

7
The Midnight Sun

9
These are just seasonal changes… what about long-term? We saw on our graph that global ice ages and warming periods occurred… how did this occur? We will learn about four mechanisms for global climate change…

10
1. Solar Irradiance It's reasonable to assume that changes in the sun's energy output would cause the climate to change, since the sun is the fundamental source of energy that drives our climate system.

11
2. Volcanism Major volcanic events can affect the Earth’s albedo, changing global temperatures.

12
3. Earth’s Precession The orbit the Earth takes around the sun will change through time, which changes its orientation to the Sun and affects the amount of sunlight reaching higher latitudes, particularly the polar regions. http://en.wikipedia.org/wiki/File:Precessing_Kepler_orbit_280fr ames_e0.6_smaller.gif

13
4. Axial Tilt

14
Axial Tilt Tilt of the Earth’s axis changes through time The tilt affects Earth’s exposure to sun, which would lead to climate change

15
How do we know past temperatures anyway? How can we determine temperatures from 1960? 1900? 10,000 BC?!?!?

16
Paleoclimatology: The study of past climate, from times prior to instrumental weather measurements. Proxy Data – Information from natural recorders of climate variability. Widely used proxy climate data include: Corals Tree Rings Ice Core records Fossilized Tree Pollen Boreholes Glacier Lengths

17
READ AND PRESENT WITH GROUPS OF 2 OR 3

18
Paleoclimatology - The study of past climate, from times prior to instrumental weather measurements. Borehole data are direct measurements of temperature from boreholes drilled into the Earth crust. Departures from the expected increase in temperature with depth (the geothermal gradient) can be interpreted in terms of changes in temperature at the surface in the past. These changes in temperature have slowly diffused downward, warming or cooling layers meters below the surface. Borehole data The image to the right is a borehole drill.
 can be interpreted in terms of changes in temperature at the surface in the past. These changes in temperature have slowly diffused downward, warming or cooling layers meters below the surface. Borehole data The image to the right is a borehole drill..")
19
Paleoclimatology - The study of past climate, from times prior to instrumental weather measurements. Glacier Lengths A study of glacier length over time indicates the change in temperature. Scientists have recorded the activity of 169 glaciers from around the world. A glacier that is becoming longer is growing due to accumulation of snow. A glacier that is receding is loosing mass. Most glaciers world wide are showing similar loss of mass. The image, above, is an aerial view of glaciers.

20
Paleoclimatology - The study of past climate, from times prior to instrumental weather measurements. Fossilized Pollen All flowering plants produce pollen grains. Their distinctive shapes can be used to identify the type of plant from which they came. Pollen grains are well preserved in the sediment layers of ponds, lakes or the ocean. An analysis pollen grains in each layer tell us what kinds of plants were growing at the time the sediment was deposited. Inferences can then be made about the climate based on the types of plants found in each layer. The image right, shows features of pollen spores from the Florida Everglades (USGS)
.")
21
Paleoclimatology - The study of past climate, from times prior to instrumental weather measurements. Ice Cores Located high in mountains and the polar ice caps, ice accumulates from snowfall compressed over many thousands of years. Scientists drill through the deep ice to collect ice cores that contain dust, air bubbles, or isotopes of oxygen, that can be used to interpret the past climate of that area. Shown above is a section of an ice core taken on the Clark Glacier in the McMurdo Dry Valleys. A 160-meter core was extracted to study the climate in the area over the past 2,000 years.

22
Paleoclimatology - The study of past climate, from times prior to instrumental weather measurements. Tree Rings Since tree growth is influenced by climatic conditions, patterns in tree- ring widths, density, etc, reflect variations in climate. In temperate regions where there is a distinct growing season, trees generally produce one ring a year, and thus record the climatic conditions of each year. Trees can grow to be hundreds to thousands of years old and can contain annually-resolved records of climate for centuries to millennia. Shown at right is a cross section of a young conifer

23
Paleoclimatology - The study of past climate, from times prior to instrumental weather measurements. Corals Corals build their hard skeletons from calcium carbonate, a mineral extracted from sea water. The carbonate contains isotopes of oxygen, as well as trace metals, that can be used to determine the temperature of the water in which the coral grew. These temperature recordings can then be used to reconstruct climate when the coral lived. Shown above are two sections of a coral core from the Galapagos. The cores are x-rayed so scientists can see the growth bands. Next, segments are marked for sampling: black lines represent annual bands, blue and red lines subdivide the year into quarters. The core is then cut along the lines and the individual segments analyzed in a laboratory.

24
REFLECTION QUESTIONS 1.Why are there seasons? 2.How is the Earth’s climate changed over larger timescales? 3.What is a proxy? 4.What are 3 proxies used to determine past climates? 5.What evidence could critics use to discredit the notion of global warming?

Similar presentations