Download presentation
Presentation is loading. Please wait.

1
Covariation in Productivity of Mid-Columbia Steelhead Populations S.P. Cramer & Associates, Inc. 600 N.W. Fariss Road Gresham, OR 97030 www.spcramer.com Brian Pyper & Steve Cramer

2
Mid – Columbia Study Area

3
Background »Population abundance »Population growth rate (productivity) »Spatial structure »Diversity Mid-Columbia steelhead ESU listed as threatened NMFS uses four measures to evaluate viable salmonid populations (McElhany et al. 2000):
:.")
4
Background “Lambda” analysis a key tool used by NMFS to assess productivity (Homes 2001; McClure et al. 2003) “Lambda” measures population growth rate and extinction risk using time series of escapement data (increasing or decreasing trend?) Model is not mechanistic Assumes no density dependence in spawner-recruit dynamics
 Lambda measures population growth rate and extinction risk using time series of escapement data (increasing or decreasing trend ) Model is not mechanistic Assumes no density dependence in spawner-recruit dynamics.")
8
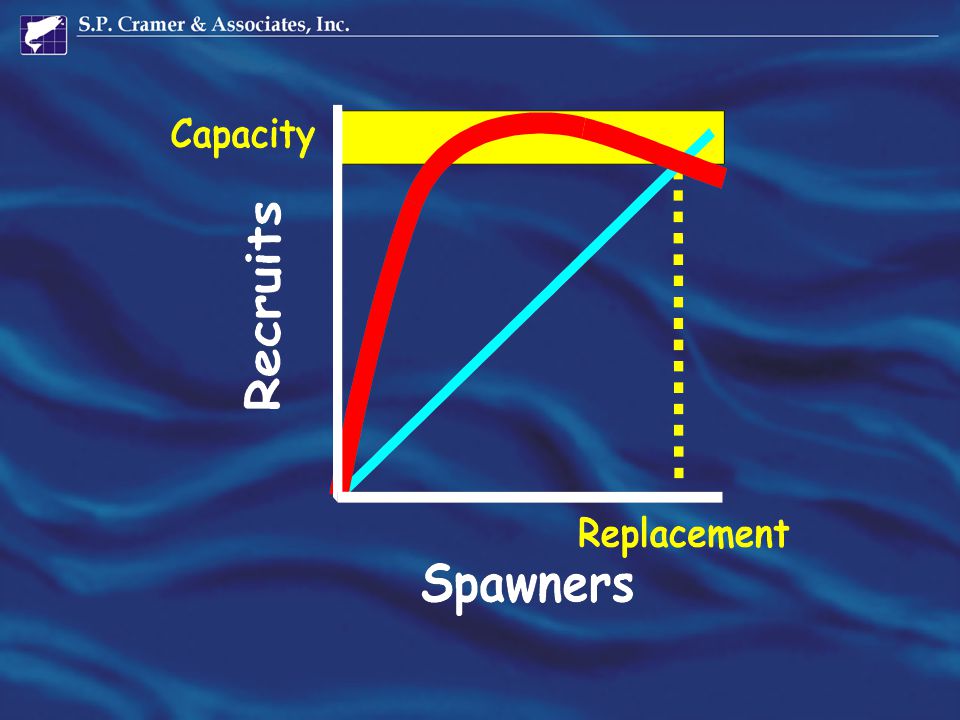
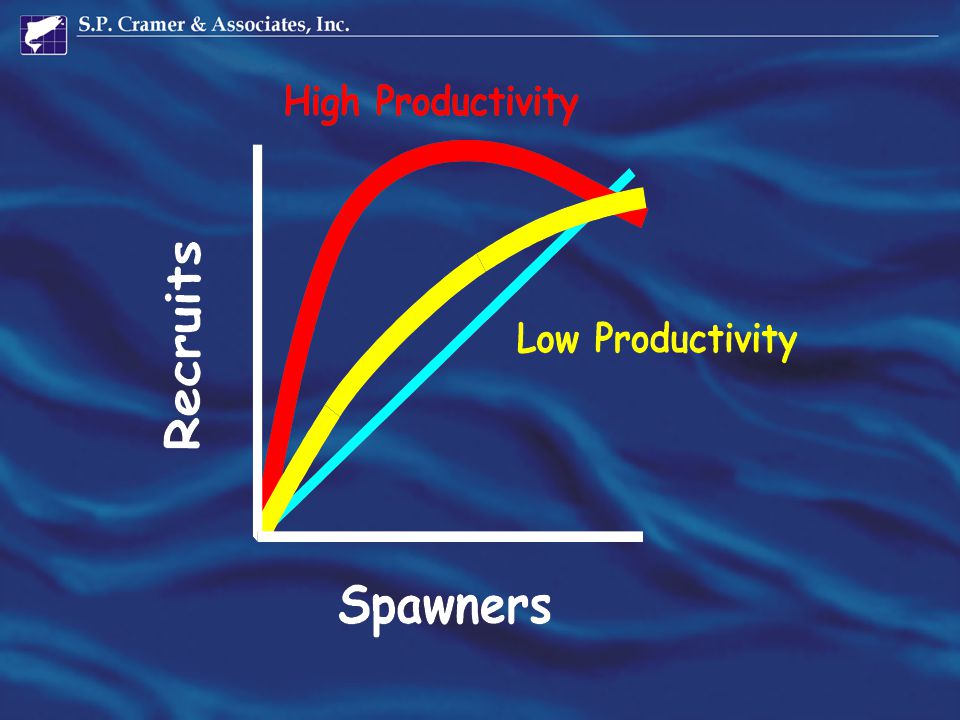
Spawner-recruit analysis Examined spawner-recruit data for 8 populations (Cramer et al. 2005) Estimated intrinsic growth rates and capacity Compared 4 spawner-recruit models: »Density independent model »Ricker model »Beverton-Holt model »Hockey-stick model Used simulations to examine potential bias
 Estimated intrinsic growth rates and capacity Compared 4 spawner-recruit models: »Density independent model »Ricker model »Beverton-Holt model »Hockey-stick model Used simulations to examine potential bias.")
9
Data Dam counts of natural-origin spawners : »Deschutes »Yakima »Umatilla Redd counts (index) for 5 John Day subpopulations: »Upper and Lower Mainstem »South, Middle, and North Forks Recruitment indices based on available harvest and age- structure data
 for 5 John Day subpopulations: »Upper and Lower Mainstem »South, Middle, and North Forks Recruitment indices based on available harvest and age- structure data")
10
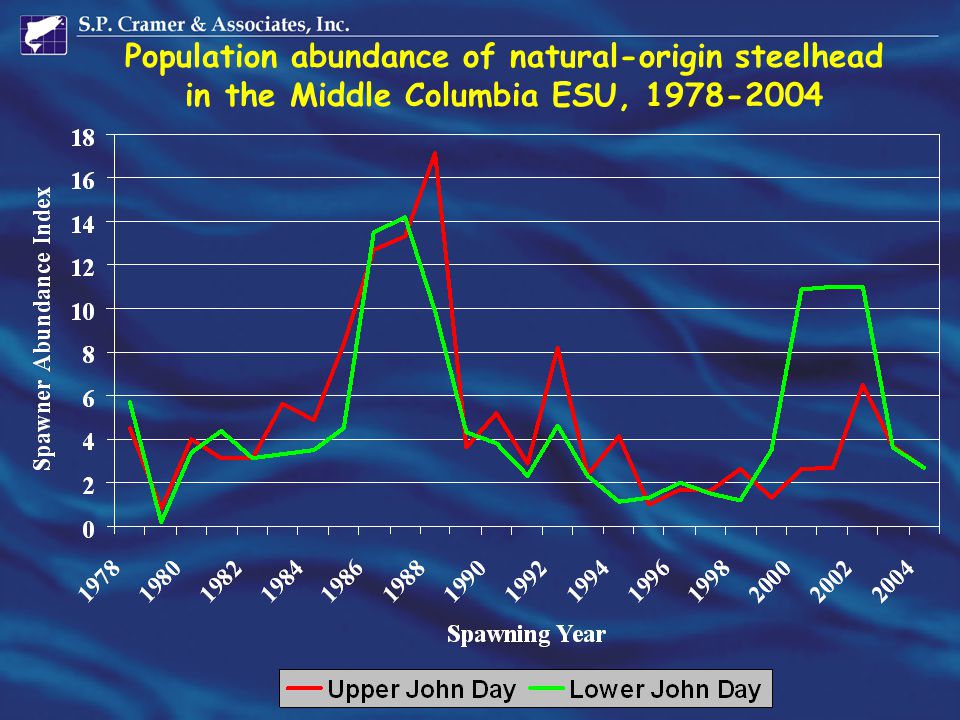
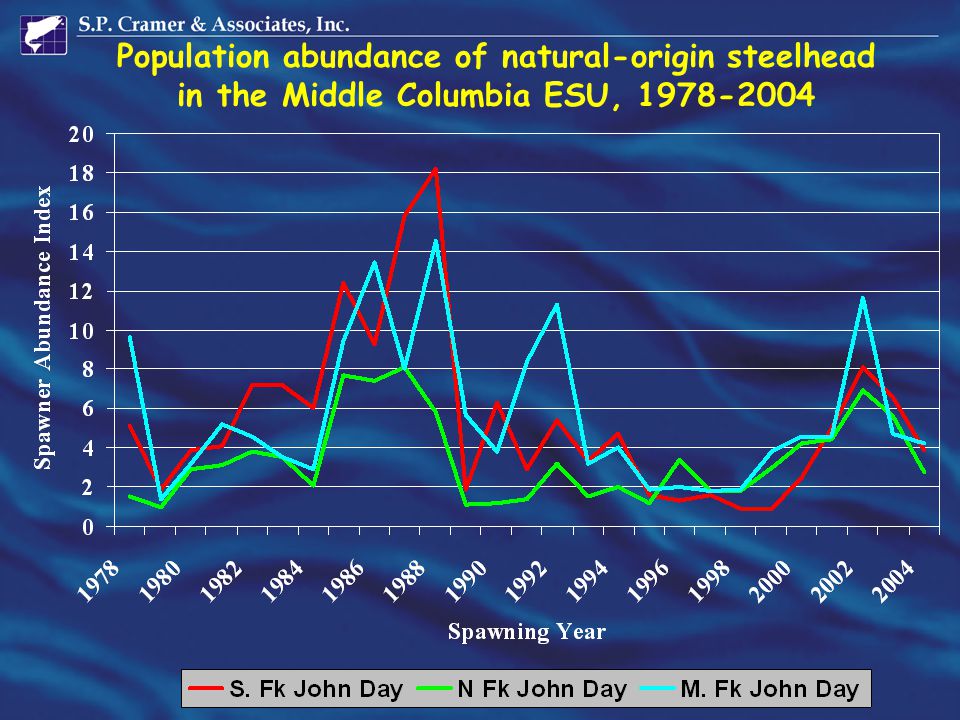
Population abundance of natural-origin steelhead in the Middle Columbia ESU, 1978-2004

13
Covariation in recruitment Escapement indices correlated (Avg. r = 0.63) Suggests shared influence of freshwater or marine conditions on survival Suggests limited measurement error Next step: Fit spawner-recruit models …
 Suggests shared influence of freshwater or marine conditions on survival Suggests limited measurement error Next step: Fit spawner-recruit models ….")
14
02468 0 2 4 6 8 10 85 86 87 88 DI RK 1:1 BH HS Spawner Index Recruit Index Fits of the spawner-recruit models to the North Fork data set of the John Day population (DI = density-independent model, RK = Ricker model, HS = logistic hockey-stick model, and BH = Beverton-Holt model).
.")
15
Model comparisons Used the AIC model-selection criterion Beverton-Holt and Hockey-stick models “best” across data sets But many unstable fits and unreasonably high estimates of intrinsic growth rate (alpha) Range in Alpha (Recruits per spawner) Beverton-Holt:5.5 to 72.9 Hockey-stick:2.4 to 20.8 Ricker:2.6 to 5.2
 Range in Alpha (Recruits per spawner) Beverton-Holt:5.5 to 72.9 Hockey-stick:2.4 to 20.8 Ricker:2.6 to 5.2")
16
Model comparisons Ricker model stable with biologically reasonable estimates of growth rate (alpha) Ricker fits much better than Density- Independent model for all 8 data sets Note: Estimates of capacity similar across forms (Ricker, Beverton-Holt, Hockey-stick) Density Independent model assumes no limit to capacity
 Ricker fits much better than Density- Independent model for all 8 data sets Note: Estimates of capacity similar across forms (Ricker, Beverton-Holt, Hockey-stick) Density Independent model assumes no limit to capacity")
17
Fits of the Ricker and Density-independent models 02468 0 2 4 6 8 10 JD North Fork 0200040006000800010000 0 2000 6000 10000 Deschutes 0100020003000 0 1000 2000 3000 Umatillla 05001000150020002500 0 1000 2000 3000 Yakima Spawner Index Recruit Index 85 86 87 88 85 86 87 88 85 86 87 88 85 86 87 88

18
051015 0 5 10 15 JD Upper Mainstem 02468101214 0 5 10 15 JD Lower Mainstem 05101520 0 5 10 15 20 JD South Fork 051015 0 5 10 15 JD Middle Fork Spawner Index Recruit Index 85 86 87 88 85 86 87 88 85 86 87 88 85 86 87 88 Fits of the Ricker and Density-independent models

19
Ricker estimates of intrinsic growth rate (alpha) Average = 3.4 recruits per spawner 0 2 4 6 8 10 12 14 Upper Mainstem Lower Mainstem South Fork Middle Fork North Fork DeschutesUmatilllaYakima Ricker Alpha (Recruits/Spawner) `
 Average = 3.4 recruits per spawner Upper Mainstem Lower Mainstem South Fork Middle Fork North Fork DeschutesUmatilllaYakima Ricker Alpha (Recruits/Spawner) `")
20
Ricker estimates of intrinsic growth rate (alpha) Average = 3.4 recruits per spawner 0 2 4 6 8 10 12 14 Upper Mainstem Lower Mainstem South Fork Middle Fork North Fork DeschutesUmatilllaYakima Ricker Alpha (Recruits/Spawner) ` Ricker Average for Density- Independent models = 1.4 Recruits/Spawner
 Average = 3.4 recruits per spawner Upper Mainstem Lower Mainstem South Fork Middle Fork North Fork DeschutesUmatilllaYakima Ricker Alpha (Recruits/Spawner) ` Ricker Average for Density- Independent models = 1.4 Recruits/Spawner")
21
Ricker estimates of capacity: unfished equilibrium spawner abundance (S*) 0 2,000 4,000 6,000 8,000 10,000 DeschutesUmatilllaYakima Ricker S* ` Spawner Abundance
 0 2,000 4,000 6,000 8,000 10,000 DeschutesUmatilllaYakima Ricker S* ` Spawner Abundance")
22
Ricker estimates of capacity: unfished equilibrium spawner abundance (S*) 0 2,000 4,000 6,000 8,000 10,000 DeschutesUmatilllaYakima Recent 5-yr geometric mean Ricker S* ` Spawner Abundance
 0 2,000 4,000 6,000 8,000 10,000 DeschutesUmatilllaYakima Recent 5-yr geometric mean Ricker S* ` Spawner Abundance")
23
Ricker estimates of capacity: John Day 0 5 10 15 20 Upper Mainstem Lower Mainstem South ForkMiddle ForkNorth Fork Recent 5-yr geometric mean Ricker S* Redds per Mile

24
051015 0 5 10 15 JD Upper Mainstem 02468101214 0 5 10 15 JD Lower Mainstem 05101520 0 5 10 15 20 JD South Fork 051015 0 5 10 15 JD Middle Fork Spawner Index Recruit Index 85 86 87 88 85 86 87 88 85 86 87 88 85 86 87 88 Influence of 1985 – 1988 brood years: Density dependence or poor ocean survival?

25
Removed years and re-fit Ricker models Similar results – still get strong evidence of density dependence (P < 0.01) for 8 data sets Consistent estimates of growth rate (alpha) Influence of 1985 – 1988 brood years
 for 8 data sets Consistent estimates of growth rate (alpha) Influence of 1985 – 1988 brood years")
26
Combined data (spawner index standardized so median = 1 for each data set)
")
27
Combined data (spawner index standardized so median = 1 for each data set)
")
28
Possible bias in Ricker parameters related to: »Short data sets »Measurement errors »Autocorrelation »Harvest rates Estimates of parameters uncertain Strong concern for NMFS (McElhany et al. 2000) Can use simulations to assess potential bias Potential problems with spawner-recruit analyses
 Can use simulations to assess potential bias Potential problems with spawner-recruit analyses.")
29
Simulated spawner-recruit data with same characteristics as Mid-Columbia data »True alpha = 3 »High autocorrelation »Low harvest rates Assumed measurement error in age structure and escapement estimates (CV = 30%) Estimated Ricker parameters for each simulated data set to assess potential bias Simulations
 Estimated Ricker parameters for each simulated data set to assess potential bias Simulations")
30
Results (500 simulations) 0 10 20 30 40 50 60 1.02.03.04.05.06.0 Estimate of Ricker alpha Number of Simulations True value = 3.0 Median estimate = 3.2
 Estimate of Ricker alpha Number of Simulations True value = 3.0 Median estimate = 3.2")
31
Bias in Ricker parameters was minimal (10 to 20%) for range of conditions typical of Mid- Columbia steelhead data sets Primary reason was low harvest rates (20% across most years) Significant bias expected for harvest rates = 40% or greater across years Simulations results
 for range of conditions typical of Mid- Columbia steelhead data sets Primary reason was low harvest rates (20% across most years) Significant bias expected for harvest rates = 40% or greater across years Simulations results")
32
Widespread evidence of density dependence in Mid-Columbia steelhead data sets Consistent estimates of intrinsic growth rates (avg. = 3.4 recruits per spawner) No evidence that one or more populations experienced relatively poor productivity “Lambda” only useful as a red-flag indicator Intrinsic growth rates suggest resilience to short-term increases in mortality Summary
 No evidence that one or more populations experienced relatively poor productivity Lambda only useful as a red-flag indicator Intrinsic growth rates suggest resilience to short-term increases in mortality Summary.")
Similar presentations

 Casey Baldwin RTT Chairperson WDFW Research Scientist.>")
 of PIT-tagged Spring/Summer Chinook and PIT-tagged Summer Steelhead 199602000 CBFWA Implementation Review Mainstem/Systemwide.>")


 Andrew J. G. Cairns (Heriot-Watt) David Blake (Pensions Institute, Cass Business School)>")

 March 14, 2012.>")


 will save them? John Williams Klarälven meeting in Karlstad 9 May 2011.>")


