Download presentation
Presentation is loading. Please wait.

1
Salmonid Population and Habitat Monitoring in the Lower Columbia/Columbia Estuary Provinces Oregon Department of Fish and Wildlife

2
ODFWS PROPOSED LOWER COLUMBIA/COLUMBIA ESTUARY PROVINCES SALMONID MONITORING PROGRAM Goal: to provide statistically-rigorous data on the status and trends of salmonid populations and stream/riparian habitats at the ESU and Population Complex scales using the EMAP sampling design

3
EMAP APPROACH Provides a statistically- rigorous method to analyze the status and trends in resources Sample sites are determined by a GIS- based spatially balanced random selection process Provides a consistent framework to integrate monitoring projects

4
ODFWS ESU AND POPULATION COMPLEX-SCALE SALMONID MONITORING PROGRAM Habitat Monitoring Status and trends in habitat quality and quantity Juvenile Coho and Steelhead Monitoring Status and Trends in juvenile coho abundance and distribution Trends in juvenile steelhead abundance Adult Spawner Abundance Monitoring Status and trends in abundance and distribution of adult coho and winter steelhead

5
Lower Columbia Coho Salmon ESU

6
Steelhead ESUs in Lower Columbia S W Washington Lower Columbia

7
Task 1: Habitat Monitoring Key Question Status of Habitat Quantity/Quality? Trends in Habitat Quantity/Quality? Spatial Distribution of habitat quality? Relationships between habitat and land use?

8
Methods 50 habitat sites 500-1000 m length of survey Standard ODFW habitat survey protocols Portion resurveyed for QA/QC

9
KEY INDICATORS Pool habitat Sediment Wood Riparian Off-channel habitat

10
100 sites for coho ESU 50 sites for each steelhead ESU HABITAT SURVEYS

11
ALL COASTAL STREAMS REFERENCE DATASET SEDIMENT HIGHER THAN REFERENCE SIMILAR TO REFERENCE

12
ALL COASTAL STREAMS REFERENCE DATASET INSTREAM WOOD SIMILAR TO REFERENCE SIGNIFICANTLY LOWER THAN REFERENCE

13
Comparison of Habitat Features Across Geographic Regions

14
Geology Volcanic Sedimentary Other % fine substrate in riffle units 0-10 31-40 11-20 41-50 21-30 N

15
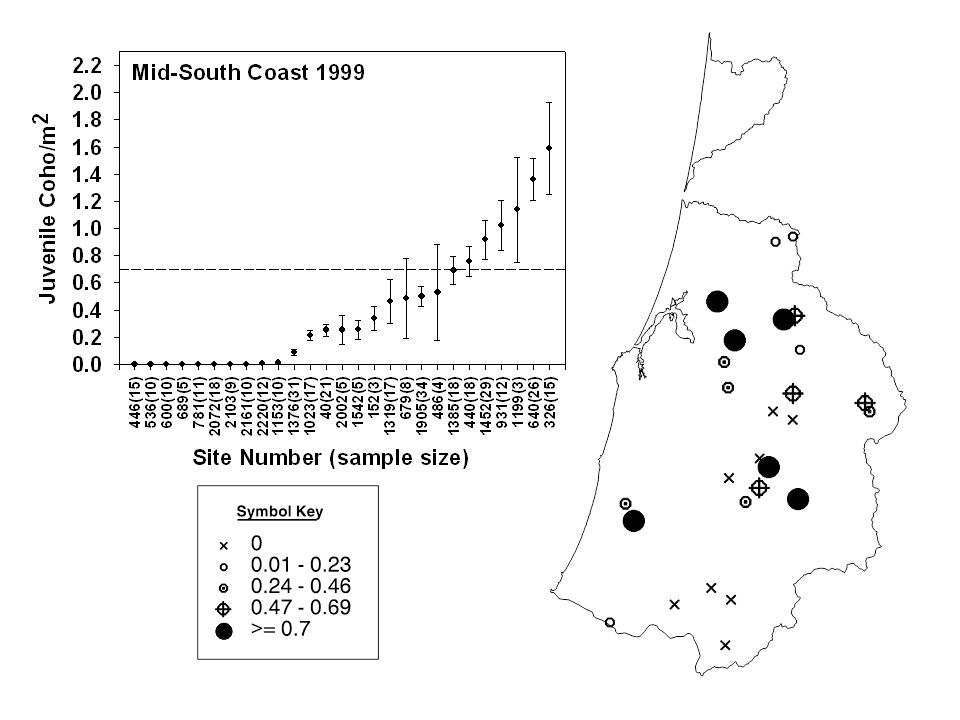
Task 2: Juvenile Monitoring Key Questions Population Status (coho)? Population Trends? Spatial and Temporal Distribution? Relationship to Parental Spawner Abundance?

16
Juvenile Salmonid Monitoring Approach Snorkel Surveys 1 km sample reaches 10-20% of sites resurveyed for QA/QC

17
100 sites for coho ESU 50 sites for each steelhead ESU JUVENILE SURVEYS

18
Precision of Juvenile Snorkel Surveys

21
Relationship Between Spawners and Juveniles

22
Egg to Parr Survival Rates

23
Task 3: Adult Abundance Monitoring Key Questions Population Status? Populations Trends? Spatial and Temporal Distribution? Occurrence of Hatchery Fish in Natural Spawning Populations?

24
MONITORING APPROACH BASED ON ADULT SPAWNERS BASED ON ADULT SPAWNERS UTILIZES VISUAL COUNTS IN STREAM SURVEYS UTILIZES VISUAL COUNTS IN STREAM SURVEYS BIOLOGICAL SAMPLING AND TAG RECOVERY FROM SPAWNED CARCASSES BIOLOGICAL SAMPLING AND TAG RECOVERY FROM SPAWNED CARCASSES

25
Coho Salmon 240 sites for the ESU 40 sites/population complex Steelhead 60 sites/ESU (2 ESUs) 20 sites/population complex ADULT SURVEYS
 20 sites/population complex ADULT SURVEYS")
26
Precision of Spawner Abundance Estimates Geographic Unit Relative Precision 1990-97 1998-2000 GoalEMAP ESU+ 28%+ 20%+ 16% MA+ 54%+ 30%+ 22% Major Basin+ 63%+ 60%+ 35%

27
COHO SPAWNER ABUNDANCE IN COASTAL ESU

28
ACCURACY OF SURVEY-BASED ABUNDANCE ESTIMATES Smith River Adult Coho

29
STREAMS SPAWNER DENSITY 0 - 5 6 - 10 11 - 20 21 - 50 51 - 100 101 - 700 COHO SPAWNER DENSITY IN MID-SOUTH COAST GCG

30
HATCHERY-WILD RATIO OF SPAWNERS

31
RATIONALE AND RELATIONSHIP TO REGIONAL PROGRAMS FWP, NMFS BiOp, Subbasin Summaries and the Oregon Plan all call for: Increased M&E of status and trends in biological and environmental conditions at the Province and Subbasin scales A framework for the coordination and integration of monitoring efforts A process to prioritize how and where habitat protection and restoration efforts are focused

32
WHAT IS AT RISK IF THIS PROJECT IS NOT FUNDED? Resource managers will continue to lack the data to evaluate resource status and trends and assess progress towards recovery Our ability to learn from what we do (adaptive management) will continue to be limited Implementing this program will provide the data to assess long-term trends in resource status at Provincial and Subbasin scales
 will continue to be limited Implementing this program will provide the data to assess long-term trends in resource status at Provincial and Subbasin scales.")
33
Thank You

Similar presentations


 Casey Baldwin RTT Chairperson WDFW Research Scientist.>")
 Karl M. Polivka, Pacific Northwest Research Station, USDA Forest Service.>")


 BPA Project Numbers: 198201302 and 198201304.>")


