Download presentation
Presentation is loading. Please wait.

1
Geographic tools and M&E: Linking data to support M&E

2
DATA LINKING

3
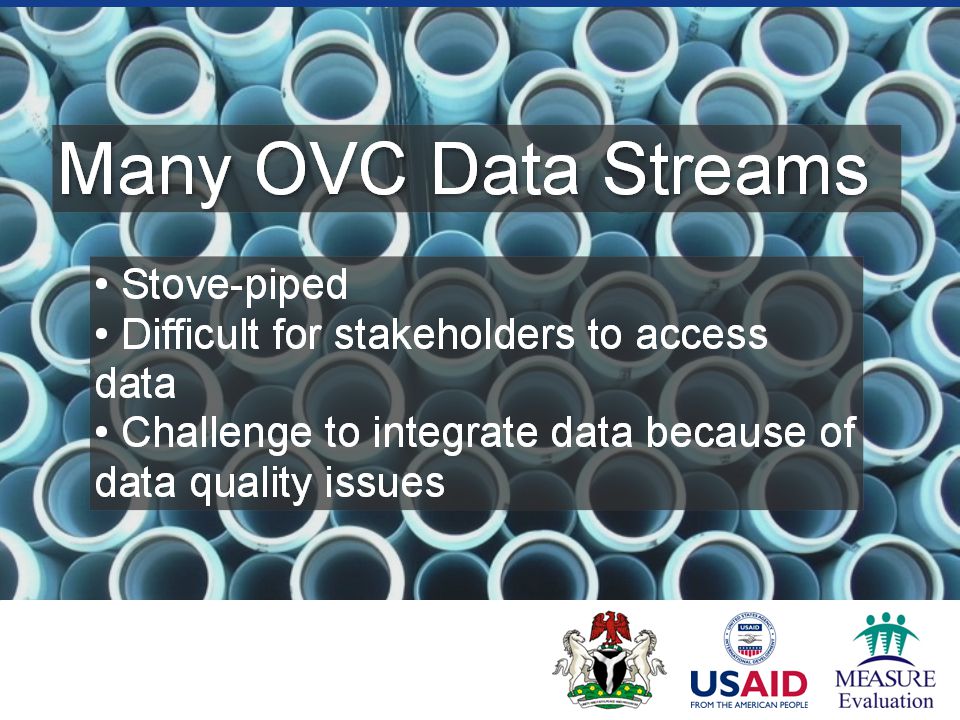
Many Data Streams

4
But it can be well worth the effort to link data

5
Value of linking: Gives insight into data by adding additional context Maximizes use of data Promotes opportunities to leverage efforts and minimize duplication of effort

6
M&E and GIS Programs don’t exist in vacuum People may be touched by multiple programs or influenced by the world around them Strengthen M&E by using that fact.

7
M&E is evolving Limitations of experimental design Growth of district based evaluation platforms

8
M&E and GIS Geography as basis for evaluation Multiple programs that can influence outcome Link data to better understand program and outcomes Spatial analysis techniques can help with deriving outcomes measures

10
GIS is a tool that can facilitate evaluation Linking data Producing tools for analysis and understanding of data GIS can support evaluation even if no maps are produced

14
GIS AND M&E

15
Programmatic successes depend on reaching the right places, the right people with the right intervention

16
Who is doing what, where in my country? http://goo.gl/Zw4Qv

18
xxx xxx Decision makers identify priorities and support programs Program is managed by an organization Program serves clients Health outcomes M&E data inform policy

19
xxx xxx xxx xxx xxx xxx xxx xxx

20
‣ It can quickly become challenging to see opportunities for integration and coordination ‣ There may not be common stakeholders participating in every step of the process

21
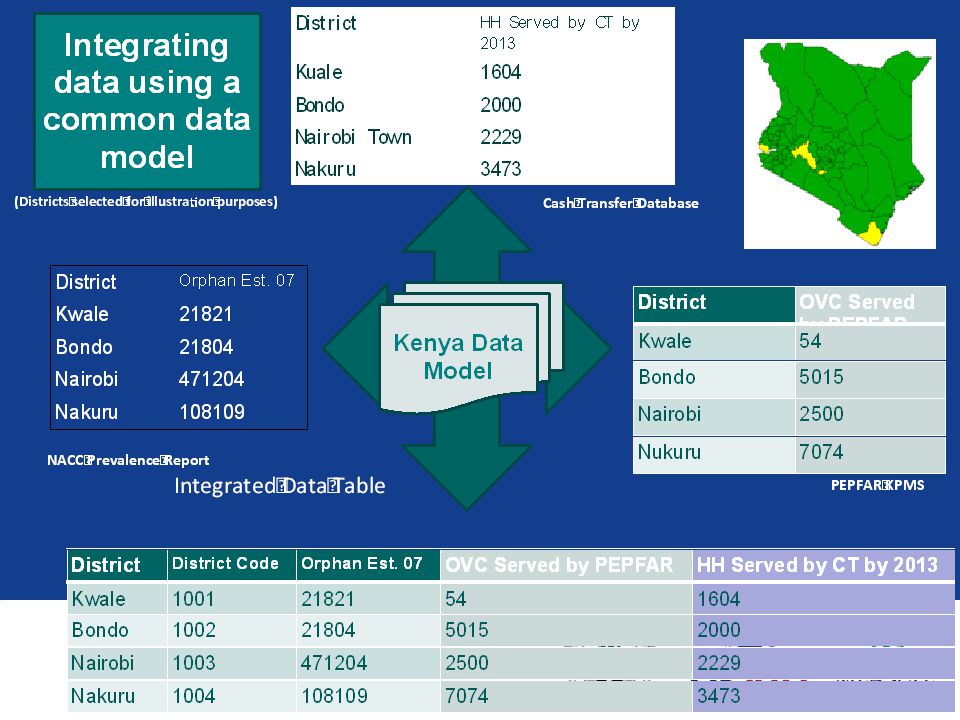
Example: Kenya OVC Program MEASURE Evaluation worked with US Mission in Kenya to improve interoperability of OVC data from 3 stakeholders

22
Data Snapshot

24
Kenya OVC Data Mode l Simple approach that makes it possible to integrate program data Geography (district) is the key
 is the key")
25
Barriers to linking data

27
Kenya Data Model Six elements that allow data to be linked together Geography Services provided Funder Implementing organization name Timeframe Number of beneficiaries

29
By linking data from multiple stakeholders it was possible to see patterns that were not observed without linking Important to note that there may be legitimate reasons why there were no services in Kuria – map doesn’t provide all the answers just points in a direction for further study.

30
Key points Evaluation is evolving Using geography (and GIS) to link data can strengthen M&E Many barriers to linking data Technical barriers may be easy to overcome, non-technical barriers may be more challenging Any questions?
 to link data can strengthen M&E Many barriers to linking data Technical barriers may be easy to overcome, non-technical barriers may be more challenging Any questions")
31
Thank You

Similar presentations


 Steering Committee March 19, 2013.>")


