Download presentation
Presentation is loading. Please wait.

1
Identifying Split Failures Due to Over Saturation (Demand> Capacity) Ed Smaglik, Darcy Bullock, Jim Sturdevant & Tom Urbanik
 Ed Smaglik, Darcy Bullock, Jim Sturdevant & Tom Urbanik")
2
Prevailing View A signal phase does not have periods of over saturation if an agency never sees or hears about problems. We need tools to tabulate performance metrics related to over saturation 24-7!

3
Outline What is saturation? How do we quantify it? Yauch v/c ratio How can we measure it? Fuhr’s. collect data for better information.. How should we look at it? What can we do?

4
Indianapolis: US 31 & 116 th

5
Saturated or Undersaturated

6
Under saturated split with slack Split reduction to improve efficiency

7
Saturated split with no slack Unmet demand at termination

8
Cycle Based Binning of q g

10
v/c ratio Need served volume available in real time Ex.. 30s green on 60s cycle Sat flow is 1800 vphpl Observed flow on green/amber is 16 v/c= 1.06 … no slack green there Served vs. Demand Issue

11
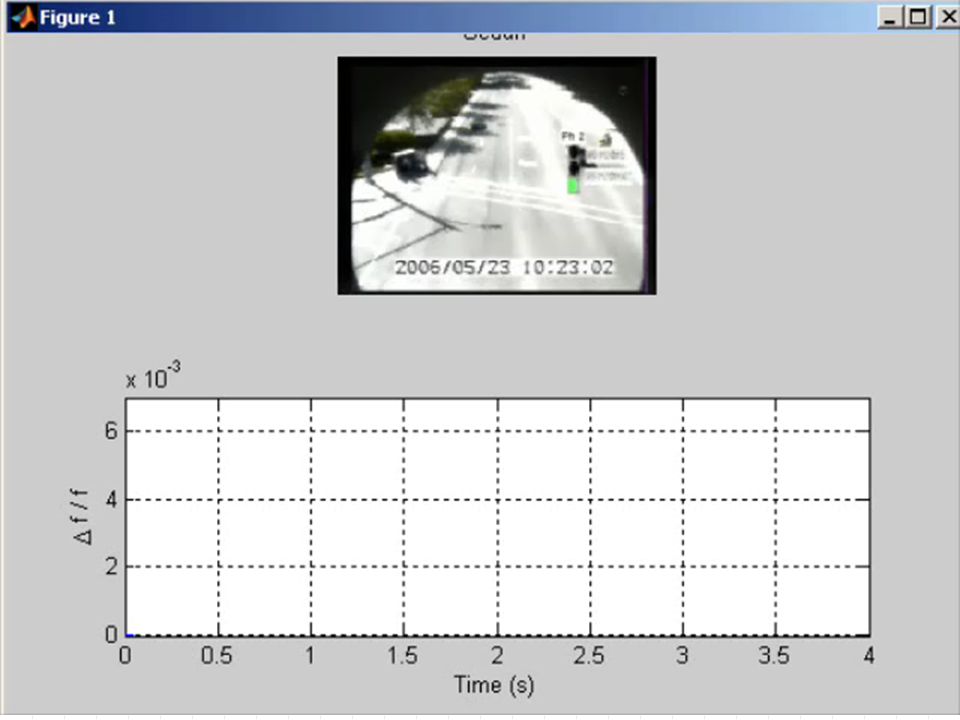
Phase 2, October 18 th, 2004

12
Noblesville site, October 18th, 2004 v/c plots 1234 5678 Split Failure?

13
1234 5678

14
Split reallocation October 18th October 26th Phase 5 Phase 6 1234 5678 +5s -5s

15
Can we infer Split Failures by estimating served volume to capacity ratios?

16
Split Failures … counting the dots>1.0 Timing Plan Duration of Operation Split Failures (Before) Number of Phases (Before) Split Failures (After) Number of Phases (After) AM Peak 3 hr584587 Mid Day 2 hr1740 PM Peak 4.5 hr 16 131 9 Off Peak 5.5 hr 17 223 5 226
 Number of Phases (Before) Split Failures (After) Number of Phases (After) AM Peak 3 hr Mid Day 2 hr1740 PM Peak 4.5 hr Off Peak 5.5 hr")
17
Comments Before we can manage during over saturation, we need to: Figure out what we are going to measure Determine how we can pull some meaningful information out of data Short term goal: develop tools to enable small, strategic human-in- the-loop to adjustments…without extensive field visits.

18
Challenges High Quality Cycle by Cycle Count Data Detection Technology Collection on Controller Quickly extracting meaningful easily understood graphs

19
Recommended LT Sensor Installation

20
Questions? Do we mess with PCEs?

21
Extra

23
Southbound Count Detectors

24
Results – Turning Movements

25
NC1234C EA1234C

26
Video Detection – Noblesville, IN: Data Collection Cabinet A – Remote Windows Computer for Data Collection B – Video Multi-plexer C – Camera Detector Cards D – Loop Detector Cards E – Patch Panel

27
Evaluation Location

28
N

Similar presentations


 Cycle - Cycle Length - Interval -. change interval - clearance interval- change + clearance = Yi.>")


 Learn terminology related to actuated signals Understand why and where actuated signals are.>")


 Understand how critical lane groups and the sum of critical lane v/s rations are determined Learn.>")
 Analysis of Signalized Intersections.>")
