Download presentation
Presentation is loading. Please wait.

2
Meeting Consumer Demands through Genetic Selection: The NCBA Carcass Merit Project Dan W. Moser on behalf of the CMP Team

3
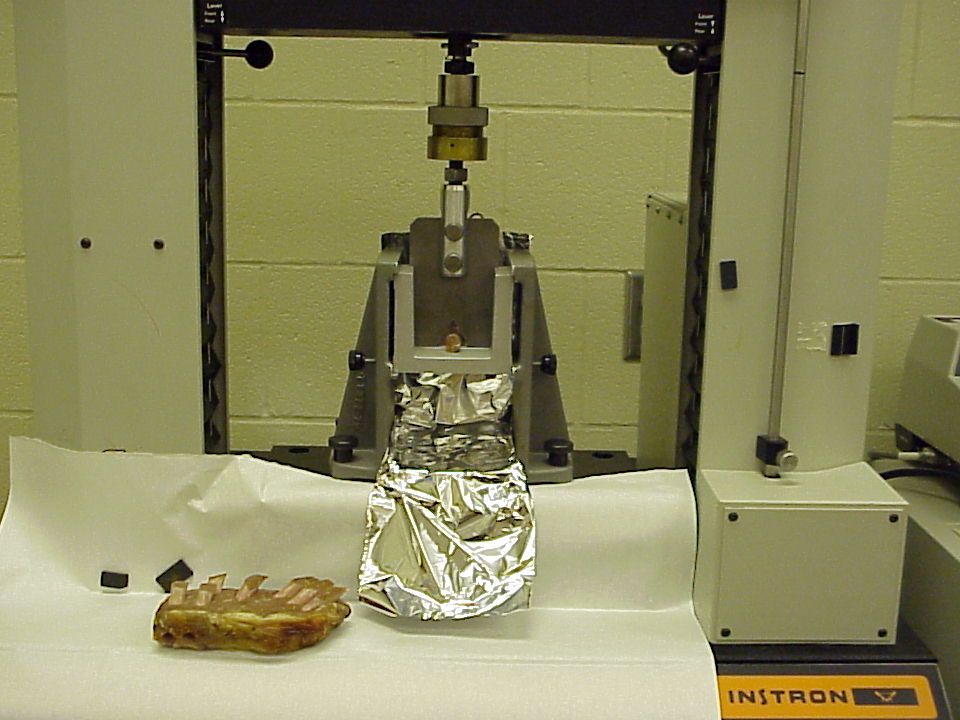
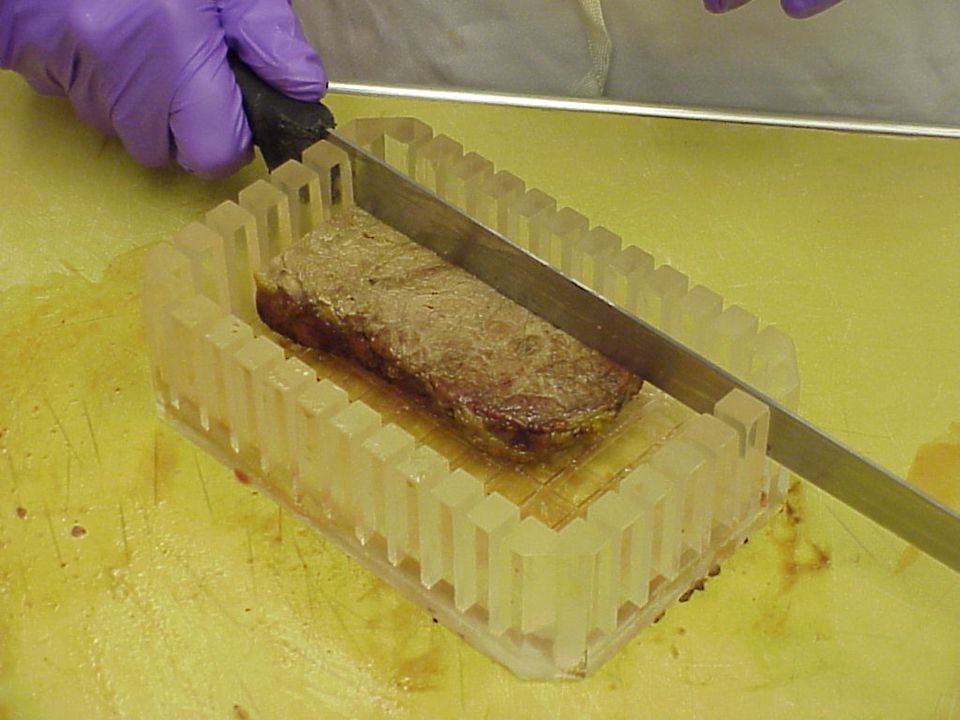
Project Team Principal Investigators: Dr. Michael Dikeman, Kansas State University Dr. Michael Dikeman, Kansas State University Shear Force Measurement, Sensory Panel Dr. John Pollak, Cornell University Dr. John Pollak, Cornell University Database Management Dr. Dan Moser, Kansas State University Dr. Dan Moser, Kansas State University Breed Association Liaison Dr. Clare Gill, Texas A&M University Dr. Clare Gill, Texas A&M University DNA Marker Validation Dr. Mark Thallman, US Meat Animal Research Center Dr. Mark Thallman, US Meat Animal Research Center DNA Marker Validation Dr. Steve Koontz, Colorado State University Dr. Steve Koontz, Colorado State University Economic Analyses

4
Project Team Collaborators: Dr. Tom Holm, MMI Genomics Marker Genotyping/DNA Analyses Project Coordinators (NCBA): Ms. Elizabeth Dressler, NCBA Project Coordinator Dr. Bo Reagan, NCBA Executive Director of Science & Technology
: Ms. Elizabeth Dressler, NCBA Project Coordinator Dr. Bo Reagan, NCBA Executive Director of Science & Technology.")
5
Project Team Steering Committee: James Bennett, VirginiaJim Bradford, Iowa James Bennett, VirginiaJim Bradford, Iowa Rob Brown, Texas John Grande, Montana Rob Brown, Texas John Grande, Montana Kathleen Hawkins, MichiganDavid Nichols, Iowa Kathleen Hawkins, MichiganDavid Nichols, Iowa

8
CMP Goals To collect data for calculation of tenderness and other carcass EPD To collect data for calculation of tenderness and other carcass EPD To validate previously identified genetic markers for tenderness and other carcass traits To validate previously identified genetic markers for tenderness and other carcass traits

9
CMP Procedures Project began in 1998, completed in 2004 Project began in 1998, completed in 2004 All US beef breed associations were invited to participate All US beef breed associations were invited to participate Costs in the project were shared by the breed associations and the $1 per head beef checkoff Costs in the project were shared by the breed associations and the $1 per head beef checkoff

10
Participating Breeds AngusBrahman BrangusCharolais GelbviehHereford LimousinMaine-Anjou Red AngusSalers ShorthornSimmental SimbrahSouth Devon

11
CMP Bulls Each breed selected: Each breed selected: 10 DNA sires 10 DNA sires 50 progeny each50 progeny each 5 sires also had sensory data collected5 sires also had sensory data collected Additional EPD sires Additional EPD sires Number based on registrationsNumber based on registrations About 25 progeny eachAbout 25 progeny each

12
CMP Procedures Cattle were generated or identified by breed associations Cattle were generated or identified by breed associations Fed in commercial feedlots Fed in commercial feedlots DNA sampled at first processing DNA sampled at first processing Associations determined management, days on feed, implants, etc. Associations determined management, days on feed, implants, etc. Harvested in commercial packing facilities Harvested in commercial packing facilities

13
Participating Packers Caldwell Packing (MN) Central Packing (FL) ConAgraExcel Greater OmahaIBP Moyer Packing (PA) Sam Kane (TX)Washington Beef
 Central Packing (FL) ConAgraExcel Greater OmahaIBP Moyer Packing (PA) Sam Kane (TX)Washington Beef")
14
CMP Procedures Carcass data collected, steaks retrieved Carcass data collected, steaks retrieved Steaks sent to K-State meats laboratory Steaks sent to K-State meats laboratory Shear steaks were aged 14 days Shear steaks were aged 14 days Sensory panel steaks were frozen after aging Sensory panel steaks were frozen after aging

15
CMP Procedures DNA samples from sires, progeny on feed and carcasses were used to confirm identity and paternity DNA samples from sires, progeny on feed and carcasses were used to confirm identity and paternity A significant number of identity and paternity errors were detected A significant number of identity and paternity errors were detected

27
CMP Procedures The project was designed to allow comparison of sires within each breed, but not sires across breeds, or breed means The project was designed to allow comparison of sires within each breed, but not sires across breeds, or breed means The average shear force of each breed in this study is as much the result of management as it is genetics The average shear force of each breed in this study is as much the result of management as it is genetics

28
Project Results 7200 progeny of 279 sires measured for shear force 7200 progeny of 279 sires measured for shear force 2400 progeny evaluated by sensory panel 2400 progeny evaluated by sensory panel 70 sires generated enough progeny for marker analysis 70 sires generated enough progeny for marker analysis 2500 progeny used in marker analysis 2500 progeny used in marker analysis

29
Phenotypic Results Carcass traits were representative of the industry Carcass traits were representative of the industry 26% of the progeny exceeded 11 lb. for WBSF 26% of the progeny exceeded 11 lb. for WBSF 20% were rated less than “slightly tender” by sensory panel 20% were rated less than “slightly tender” by sensory panel Sire progeny means within a breed varied by 1.90 to 6.62 lb. Sire progeny means within a breed varied by 1.90 to 6.62 lb.

30
Genetic Parameters Shear force is: Shear force is: Highly heritable in most breeds Highly heritable in most breeds Strongly correlated with sensory panel tenderness Strongly correlated with sensory panel tenderness The genetic correlation of shear force and marbling is: The genetic correlation of shear force and marbling is: Moderate to low, but favorable Moderate to low, but favorable Breed dependent? Breed dependent?

31
Shear Force EPD Currently published by: Currently published by: Simmental Simmental Simbrah Simbrah Shorthorn Shorthorn Hereford Hereford Over 200 sires in all Over 200 sires in all All breeds have received data All breeds have received data

32
Evaluation of Marker Data Eleven QTL discovered in previous checkoff funded research Eleven QTL discovered in previous checkoff funded research Initial evaluation was simple and conducted on an individual sire basis Initial evaluation was simple and conducted on an individual sire basis Significant collaborative efforts by a number of scientists led to a “state of the art” project-wide analysis of these data Significant collaborative efforts by a number of scientists led to a “state of the art” project-wide analysis of these data

33
Evaluation of Genetic Markers 1234

34
Significant QTL Effects QTL Significant Traits 6 Shear force, Tenderness, Ribeye Area 7 Carcass weight, Ribeye Area 8 Carcass weight, Tenderness, Ribeye Area, Flavor 10Tenderness 11Marbling

35
Marker Evaluation Results All eleven QTL were evaluated for effects on nine carcass and meat quality traits All eleven QTL were evaluated for effects on nine carcass and meat quality traits Five QTL had highly significant (P <.01) effects on at least one trait Five QTL had highly significant (P <.01) effects on at least one trait Two other QTL had significant (P <.05) effects on at least one trait Two other QTL had significant (P <.05) effects on at least one trait
 effects on at least one trait Five QTL had highly significant (P <.01) effects on at least one trait Two other QTL had significant (P <.05) effects on at least one trait Two other QTL had significant (P <.05) effects on at least one trait")
36
QTL 6 Highly significant for shear force and overall tenderness Highly significant for shear force and overall tenderness Accounts for 12 and 13% of phenotypic variance (V P ), respectively Accounts for 12 and 13% of phenotypic variance (V P ), respectively Significant for ribeye area Significant for ribeye area Accounts for 7% of V P Accounts for 7% of V P Significant for shear force and overall tenderness in previous research Significant for shear force and overall tenderness in previous research
, respectively Accounts for 12 and 13% of phenotypic variance (V P ), respectively Significant for ribeye area Significant for ribeye area Accounts for 7% of V P Accounts for 7% of V P Significant for shear force and overall tenderness in previous research Significant for shear force and overall tenderness in previous research")
37
QTL 7 Highly significant for ribeye area and carcass weight Highly significant for ribeye area and carcass weight Accounts for 7 and 6% of V P, respectively Accounts for 7 and 6% of V P, respectively Significant for juiciness Significant for juiciness Accounts for 7% of V P Accounts for 7% of V P

38
QTL 8 Highly significant for carcass weight Highly significant for carcass weight Accounts for 10% of V P Accounts for 10% of V P Significant for shear force, tenderness, ribeye area and flavor Significant for shear force, tenderness, ribeye area and flavor Accounts for 6, 9, 3 and 4% of V P, respectively Accounts for 6, 9, 3 and 4% of V P, respectively Effects among all five traits are favorably correlated Effects among all five traits are favorably correlated

39
QTL 10 Highly significant for overall tenderness Highly significant for overall tenderness Accounts for 4% of V P Accounts for 4% of V P Significant for juiciness Significant for juiciness Accounts for 5% of V P Accounts for 5% of V P

40
QTL 11 Highly significant for marbling Highly significant for marbling Accounts for 8% of V P Accounts for 8% of V P

41
Other Promising QTL QTL 4, significant for fat thickness QTL 4, significant for fat thickness Accounts for 5% of V P Accounts for 5% of V P QTL 5, significant for fat thickness QTL 5, significant for fat thickness Accounts for 6% of V P Accounts for 6% of V P Significant for fat thickness in previous research Significant for fat thickness in previous research

42
QTL Effects by Trait TraitQTL Shear Force 68 Tenderness6810 Ribeye Area 678 Carcass Weight 78 Marbling11 Fat Thickness 45 Flavor8 Juiciness710

43
Further Details Dr. Mark Thallman will lead a discussion of the CMP marker analysis in the Emerging Technologies subcommittee, this afternoon Dr. Mark Thallman will lead a discussion of the CMP marker analysis in the Emerging Technologies subcommittee, this afternoon

44
Economic Considerations USDA Quality Grade does not adequately segregate steaks by level of tenderness USDA Quality Grade does not adequately segregate steaks by level of tenderness Economic impacts of improving tenderness vary by grade Economic impacts of improving tenderness vary by grade

45
Impact of Tenderness on Retail Price* USDA Grade Increase in Retail Price Prime1.4 Premium Choice 2.5 Choice3.6 Select4.2 *Impact of a 10% improvement in tenderness

46
How Can Producers Use These Results? Use Shear Force EPD in selection Use Shear Force EPD in selection Use of the marker results requires commercialization by a partner company Use of the marker results requires commercialization by a partner company Commercial tests could be in the form of linked markers (now) and/or direct tests (later) Commercial tests could be in the form of linked markers (now) and/or direct tests (later)
 and/or direct tests (later) Commercial tests could be in the form of linked markers (now) and/or direct tests (later).")
47
Implementing Marker- Assisted Selection Collect DNA on sire Collect DNA on sire Collect DNA and phenotypes on (50?) progeny Collect DNA and phenotypes on (50?) progeny Determine markers that have significant effects for that sire Determine markers that have significant effects for that sire Select future progeny of sire based on marker results Select future progeny of sire based on marker results Currently used in dairy and swine Currently used in dairy and swine
 progeny Collect DNA and phenotypes on (50 ) progeny Determine markers that have significant effects for that sire Determine markers that have significant effects for that sire Select future progeny of sire based on marker results Select future progeny of sire based on marker results Currently used in dairy and swine Currently used in dairy and swine")
48
QTL Effects by Trait TraitQTL Shear Force 68 Tenderness6810 Ribeye Area 678 Carcass Weight 78 Marbling11 Fat Thickness 45 Flavor8 Juiciness710

49
Disadvantages of Linked Markers Need some phenotypes on progeny of sire before selection Need some phenotypes on progeny of sire before selection Only progeny of heterozygous sires are testable Only progeny of heterozygous sires are testable Identify progeny that received favorable allele from sire, but does not identify homozygous favorable animals Identify progeny that received favorable allele from sire, but does not identify homozygous favorable animals

50
Direct Tests Data from CMP and previous research could be useful in further development of these linked QTL into direct tests Data from CMP and previous research could be useful in further development of these linked QTL into direct tests Time? Time? Cost? Cost? Linked markers could be used until direct tests are available Linked markers could be used until direct tests are available

51
Other Benefits of CMP

52
Cooperation among breed associations Cooperation among breed associations Raised awareness and visibility of marker-assisted selection Raised awareness and visibility of marker-assisted selection Advancement of statistical approaches to marker analysis Advancement of statistical approaches to marker analysis

53
Other Benefits of CMP Multi-breed database of DNA and phenotypes Multi-breed database of DNA and phenotypes For validation of genetic tests For validation of genetic tests For further discovery and development For further discovery and development Quite possibly the greatest benefit of all Quite possibly the greatest benefit of all

56
Project Team Dr. Michael Dikeman, Kansas State University Dr. Michael Dikeman, Kansas State University Shear Force Measurement, Sensory Panel Dr. John Pollak, Cornell University Dr. John Pollak, Cornell University Database Management Dr. Dan Moser, Kansas State University Dr. Dan Moser, Kansas State University Breed Association Liaison Dr. Mark Thallman, US Meat Animal Research Center Dr. Mark Thallman, US Meat Animal Research Center DNA Marker Validation Ms. Elizabeth Dressler, NCBA Project Coordinator Ms. Elizabeth Dressler, NCBA Project Coordinator

Similar presentations


 - Brazil.>")


