Download presentation
Presentation is loading. Please wait.

1
Initial Baseline Assessment Results Disturbance Thresholds Group September 3, 2013 Portland State University Theresa Burcsu tburcsu@pdx.edu

4
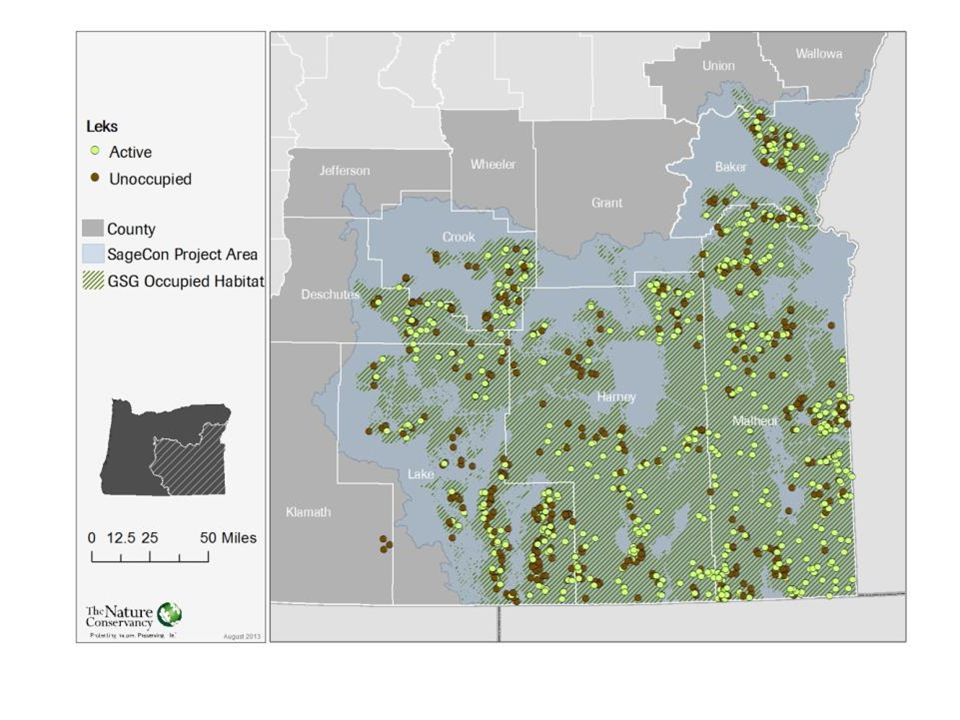
VALUES CALCULATED USING THE 5 KM RADIUS AREA AROUND LEKS.

5
BLM Districts dreakdown

6
Percent Sagebrush by BLM District

7
Percent Sagebrush by ODFW Habitat Designation CoreLow

8
Percent Developed by BLM District

9
Percent Developed by ODFW Habitat Designation

10
VALUES CALCULATED USING VARIOUS SPATIAL UNITS

12
County Proportions CountyTotal area (ac) Proportion of project area (%) Proportion of occupied habitat in county within project area (%) Proportion of full county in occupied habitat (%) Wallowa2,017,326.717.800 Union1,304,570.048.17.83.8 Baker1,975,798.9100.032.9 Wheeler1,097,486.730.500 Grant2,897,538.054.55.02.7 Jefferson1,145,886.046.300 Crook1,911,120.199.9932.5 Malheur6,355,367.4100.083.4 Deschutes1,954,242.365.4239.826.0 Harney6,545,426.9100.077.6 Lake5,350,759.297.448.547.2 Klamath3,928,128.916.900
 Proportion of project area (%) Proportion of occupied habitat in county within project area (%) Proportion of full county in occupied habitat (%) Wallowa2,017, Union1,304, Baker1,975, Wheeler1,097, Grant2,897, Jefferson1,145, Crook1,911, Malheur6,355, Deschutes1,954, Harney6,545, Lake5,350, Klamath3,928,")
13
Key Landscape Attributes Values calculated for the whole landscape unit. Core AreaDistrict_NMCOUNTYMZ IVMZ V Core Area Low Density Burns District Lakeview District Prineville District Vale District Wallowa Union Baker Wheeler Grant Jefferson Crook Malheur Deschutes Harney Lake Klamath Snake River Plain MZ Northern Great Basin MZ PCT_SAGE74.8670.5850.4757.4936.7251.541.755.5825.5829.2912.5043.7748.8266.3049.6855.1156.3416.8369.7235.14 PCT_AG0.570.485.182.202.154.610.0513.115.880.640.219.532.693.661.804.592.570.193.114.87 PCT_DEVELOP0.50 1.501.232.791.490.193.252.301.311.154.452.061.146.461.331.400.642.091.31 PCT_BURN8.569.1013.046.944.7610.4510.161.378.635.758.734.591.5712.324.0813.795.440.009.577.87 Total Disturbance (without fire)1.070.986.683.424.946.110.2416.368.181.951.3613.984.754.818.265.923.970.845.216.18 Total Disturbance (w fire)9.6310.0819.7210.369.7016.5610.4017.7316.817.7010.0918.576.3317.1312.3419.719.410.8414.7814.05
 Total Disturbance (w fire)")
14
At this spatial unit, things look pretty good.

15
However, when you begin to partition the state, the picture changes substantially.

16
Across different units, the picture is quite different Dashed lines separate spatial assessment units (e.g., core-low density from BLM districts) ODFWBLMCounties
 ODFWBLMCounties")
17
Human and fire disturb habitat on the landscape. Assumptions: Human disturbances are permanent. Natural disturbances are temporary. ODFWBLMCounties MZs

18
What is the recovery time of habitat following a fire disturbance? What is the effect on sage-grouse? It depends on factors such as the extent, severity, etc. ODFWBLMCounties MZs

26
Cautions The Oregon population is declining; Average annual decline since 1980 is -4.0% per year. Key threats in Oregon are difficult to control. Both are increasing. The relationship between lek status and development shows a steep decline to three percent – Knick found that 99 percent of active leks had less than 3 percent development within 5 km. Three percent is not where populations start to decline. Success rates for recovering/improving sagebrush habitat are low. Sagebrush habitats take more than 20 to 30 years to mature; sage grouse use may take even longer to recover at a disturbed site. Due to sage-grouse’s fidelity to sites, birds may continue to return to leks many years after habitat disturbances occur – giving a false impression of their ability to withstand disturbance.

27
Trial Balloon Proposal Conservative threshold with future increases tied to: (a)Stable or Increasing population numbers; and (b)Documented effectiveness of offset actions based on: - population response to restoration treatments; -effectiveness of threat reduction measures Consider setting thresholds by type of development (e.g. agricultural conversion, roads versus transmission versus solar) Consider applying a disturbance allowance to all Core Habitat or a percent of Core Habitat
 Consider applying a disturbance allowance to all Core Habitat or a percent of Core Habitat.")
28
Base Facts Current Core Policy on avoidance of core habitat affects 28% of the current range in Oregon; 72 percent of the range has option for offsetting impacts from unavoidable impacts. 1 percent of a 4 miles buffered lek 80 acres of direct impact (habitat conversion).
..")
Similar presentations