Download presentation
Presentation is loading. Please wait.

1
© CCSR Building Pathways from the Middle Grades to College: Learnings from the work of the Chicago Consortium of School Research (CCSR) and CRIS Presented by Jenny Nagaoka and Eliza Moeller October 21, 2014 Bush Institute Dallas, Texas
 and CRIS Presented by Jenny Nagaoka and Eliza Moeller October 21, 2014 Bush Institute Dallas, Texas")
2
© CCSR Overview Brief background on the Consortium on Chicago School Research and the College Readiness Indicator Systems Project. What matters for college success Predictors of high school graduation What happens in the transition to high school Middle grade indicators of high school and college readiness

3
© CCSR Mission of the University of Chicago Consortium on Chicago School Research CCSR’s mission is to support the search for solutions in ways that: build the capacity of schools to improve by identifying strategies and levers for improvement and working across all levels of the system. (Roderick, Easton, & Sebring, 2009) We seek to build the capacity of schools and the district through: Research identifying what matters: Organizing frameworks Indicator development: The critical role of measurement Identify leverage points: Support in identifying strategies for improvement Outreach to a broad audience: Accessible and actionable publications and presentations and individual school data reports.
 We seek to build the capacity of schools and the district through: Research identifying what matters: Organizing frameworks Indicator development: The critical role of measurement Identify leverage points: Support in identifying strategies for improvement Outreach to a broad audience: Accessible and actionable publications and presentations and individual school data reports..")
4
© CCSR What is a College Readiness Indicator System (CRIS)? A system of indicators that: – Measures distinct dimensions of college readiness: academic preparedness, college knowledge, academic tenacity; – Allows for early identification of students in need of added supports to finish high school “college-ready”; – Points to actions at three levels: individual, setting, and system

5
© CCSR CRIS promotes an expanded view of college readiness ACADEMIC PREPAREDNESS ACADEMIC TENACITY COLLEGE KNOWLEDGE Coursework, skills, and achievements needed to succeed at college-level work Beliefs, motivation, attitudes, and behaviors needed to successfully engage with academic challenges and college-going goals Knowledge, skills, and behaviors needed to access college and successfully navigate its demands

6
© CCSR What matters for college success? Grades (B or better) and College Choice
 and College Choice")
7
© CCSR What matters for college success? Grades (B or better) and College Choice
 and College Choice")
8
© CCSR Roderick, Nagaoka, Moeller, & Coca (2006)
")
9
© CCSR What are does CCSR research tell us about the importance of college knowledge and academic preparedness? College qualifications matter : – Qualifications limit the number of college options students have – Students with low qualifications are unlikely to attain a degree. College choice and institutions matter: – Particularly for students who are “college ready”, their probability of graduating varies by which institution they attend. High schools have an important role in building a college-going climate and providing structured guidance for students to fill in college knowledge gaps so they make informed college choices.

10
© CCSR What matters for high school graduation? Grades and attendance

11
© CCSR 9th graders who are on track are four times more likely to graduate than students who are off track Allensworth and Easton (2005)
")
12
© CCSR Allensworth and Easton (2005)
")
13
© CCSR Allensworth and Easton (2007)
")
14
© CCSR What happens in the transition to high school? Grades and attendance decline

15
© CCSR Allensworth, Gwynne, Moore, & de la Torre (forthcoming )
")
16
© CCSR Allensworth, Gwynne, Moore, & de la Torre (forthcoming )
")
17
© CCSR What indicators matter for middle grades? Grades and attendance

18
© CCSR What are the best indicators of high school success? Core GPA and attendance in eighth grade best predict whether students in high school pass and earn As or Bs Test scores in middle grades predict whether students reach ACT’s test score benchmarks Other information doesn’t tell us more about who will pass, get high grades or get good test scores, including… Race, gender, special education status, bilingual status, age Subtest scores Grades in particular classes Yearly test score gains and test score growth over the middle grades Changes in grades over the middle grades Perseverance, study habits Discipline records, suspensions

19
© CCSR Students’ GPA can change over the middle grade years by more than half a point Growth in GPA from Fifth Grade to Eighth Grade Comparing students who start with similar GPA in fifth grade

20
© CCSR Students’ attendance rates in the middle grades are also quite malleable Growth in Attendance Rates from Fifth Grade to Eighth Grade Comparing students who start with similar attendance in fifth grade Allensworth, Gwynne, Moore, & de la Torre (forthcoming )
")
21
© CCSR Growth in Reading Test Scores from Fifth Grade to Eighth Grade Comparing students who start with similar test scores in fifth grade Students maintain the same rank order relative to their peers throughout the middle grades in ISAT reading Highest Growth (95th percentile) Lowest Growth (5th percentile)
 Lowest Growth (5th percentile)")
22
© CCSR Who is at risk of falling off-track and who has the potential to get B or better in high school?

23
© CCSR Students with high absence rates or low grades in the middle grades are likely to be off-track for graduation Note: Based on students entering ninth grade in the 2009-10 school year Students’ risk of being off-track in ninth grade by eighth-grade core GPA and attendance rate

24
© CCSR Students’ probability of earning As or Bs in ninth grade by core eighth-grade GPA and attendance rate Only students with the best grades and attendance in middle school are likely (but not guaranteed) to earn As and Bs in ninth grade. Note: Based on students entering ninth grade in the 2009-10 school year

25
© CCSR Middle-grade information can be used to create simple indicator systems for high school graduation and college readiness with just three indicators Freshman on-track status and GPA are best predicted by earlier grades and attendance. High school test scores are strongly predicted by earlier test scores. Grades and attendance are much more malleable than test scores. Middle-grade indicators can identify some students at high risk of failure in ninth grade, but most students who end up off-track are not struggling in eighth grade. Summary

26
© CCSR An evolution of data-driven practice in the Network for College Success Moving from On-Track to College Readiness

27
© CCSR Network for College Success Professional learning community of 17 diverse CPS high schools Principals and APs College Counselors Instructional Leadership Teams Freshman Success Teams Closely affiliated with CCSR, familiar with CCSR research Committed to making practice public Sharing data, sharing strategies

28
© CCSR Early, substantial, and sustained improvements in the proportion of students on-track to graduate A History of On-Track in NCS

29
© CCSR

30
Early, substantial, and sustained improvements in the proportion of students on-track to graduate Big lessons learned Data is critical - know what problem you’re solving Attendance is a huge lever What happens in the classroom matters Real change is teacher-driven – and teachers need to be able to talk to each other about individual students Challenges remained: A History of On-Track in NCS

31
© CCSR

32
Early, substantial, and sustained improvements in the proportion of students on-track to graduate Big lessons learned Data is critical - know what problem you’re solving Attendance is a huge lever What happens in the classroom matters Real change is teacher-driven Challenges remained: Inconsistent success with the most vulnerable students – grouping by incoming test score wasn’t working Need help working on the problem in real time Itchiness to “move to college readiness” A History of On-Track in NCS

33
© CCSR Response to the Middle Grades work

34
© CCSR ADD LIKELIHOOD OF GETTING As and Bs!!!!!! Response to the Middle Grades work

35
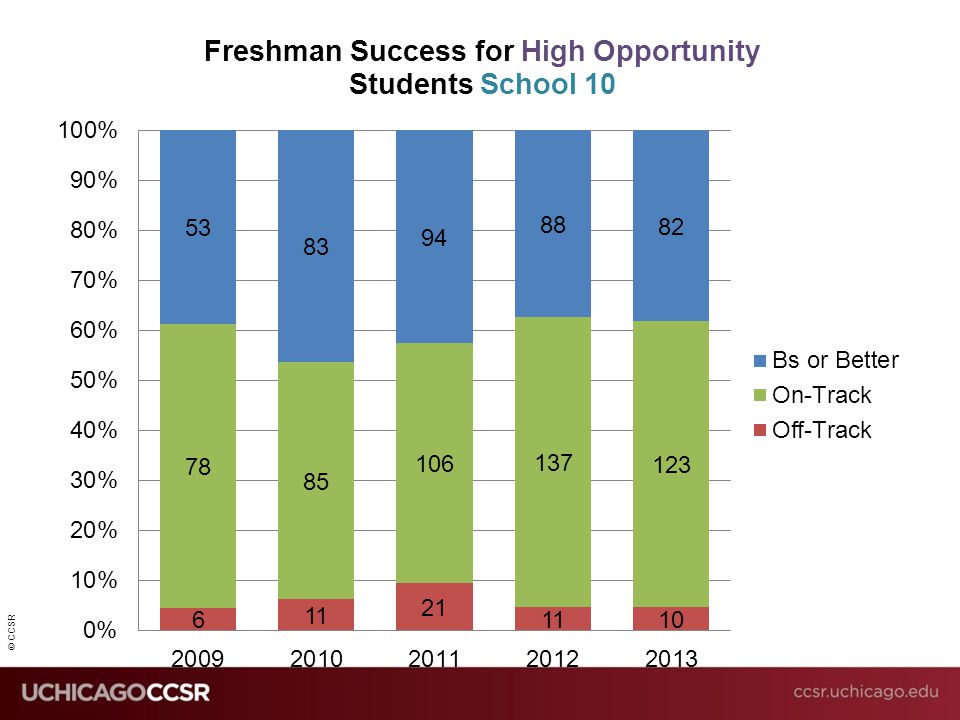
© CCSR What kinds of freshmen does each school serve? What is the “risk and opportunity” of the freshman class? How successful has each school been at keeping the students it has on-track to graduate? How successful has each school been at preparing the students it has to succeed in college? Can we manage and influence these trends in our schools in real time this year? How can we leverage the collective knowledge of our professional community to develop effective strategies for increasing success for all students? New Approach to Freshmen Success

36
© CCSR Response to the Middle Grades work

37
© CCSR Students with high absence rates or low grades in the middle grades are likely to be off-track for graduation Note: Based on students entering ninth grade in the 2009-10 school year Students’ risk of being off-track in ninth grade by eighth-grade core GPA and attendance rate

38
© CCSR 8th Grade Risk/Opportunity 8th Grade Core GPA 0-1.01.0-2.02.0-3.03.0-4.0 ≥ 98% ≥ 95% ≥ 90% ≥ 80% <80% 8th Grade Attendance

39
8th Grade Risk/Opportunity High Opportunity Less than 10% chance of being off track 3.5 Average 8 th Grade GPA 98% Average 8 th Grade Attendance Systemwide, 31% of incoming Freshmen were in this category in 2012 Opportunity 10-24% chance of being off track 2.8 Average 8 th Grade GPA 97% Average 8 th Grade Attendance Systemwide, 19% of incoming Freshmen were in this category in 2012 At-Risk 25-49% chance of being off track 2.3 Average 8 th Grade GPA 95% Average 8 th Grade Attendance Systemwide, 34% of incoming Freshmen were in this category in 2012 High Risk 50% or more chance of being off track 1.6 Average 8 th Grade GPA 86% Average 8 th Grade Attendance Systemwide, 16% of incoming Freshmen were in this category in 2012 These analyses do NOT include students who matriculate from charter schools or from outside CPS!!!!

40
© CCSR

44
Work Currently Underway Real-time data –Monitoring results for the 2014 freshman cohort Same song: –Data, solving the right problem, learning from your peers, etc. Different verse: –Discussion of limiting talent loss is different from mitigating failure

45
© CCSR Quick Discussion Grab an elbow partner or two and discuss… 1.What stood out to you about the research and data presented? Anything surprising? 2.What’s similar about these research findings in your local context? What’s different? 3.How might you use something like the “risk and opportunity” framework in your district or your school?

46
© CCSR Discuss for each school and prepare to share with your peers: What kind of students does your school serve? How successful is your school doing at –Getting students on track to graduate? –Getting students to achieve B averages? Is your school doing better with some students than others? –Which students? How can you tell? What is one question about teaching, learning, or student support that you’d want to ask your school’s principal?

47
© CCSR For full pdf versions of reports, please visit ccsr.uchicago.edu or contact Jenny Nagaoka at jkn@uchicago.edu or Eliza Moeller at meliza@uchicago.edu jkn@uchicago.edu meliza@uchicago.edu

48
© CCSR Grades also decline substantially in 9 th grade Percent of students by GPA categories in 8 th and 9 th grade (same students in each year, 2008-09 in 8 th grade, 2009-10 in 9 th grade)
")
49
© CCSR Attendance rates dramatically drop in 9 th grade Percent of students by attendance categories in 8 th and 9 th grade (same students in each year, 2008-09 in 8 th grade, 2009-10 in 9 th grade)
")
Similar presentations