Download presentation
Presentation is loading. Please wait.

1
Class 24 Case: Edgcomb Metals

2
Edgcomb Metals 21 service centers doing $500 million in sales
Supplied by large steel companies 35,000 customers (any firm using some kind of steel) Services include cutting, shaping, and daily delivery.
 Services include cutting, shaping, and daily delivery.")
3
Troy Plant 72K plant serving customers in Virginia
Seven trucks, eight trailers Seven drivers $9.50 and hour with 50% for overtime Customized uniforms with American flag patch Daily deliveries to seven “sectors” Product for each “run” was loaded at the plant each morning in “optimum” order. Customers unload. Drivers assigned “randomly” to sectors.

4
Spencer versus Williams
Spencer spoke up at the most recent drivers’ meeting: We get paid by the hour with time and a half for overtime. Some of us hustle throughout the day, finish early, and help in the shop. Some of us don’t hustle and end up with overtime as a result. I want to work hard…..and it’s not right that others get rewarded for NOT working hard.

5
Exhibit 2 Month TONS MILES STOPS REG HRS OT HRS Jun-83 3043 34907 719
1182 362 May-83 2889 38799 728 1259 360 Apr-83 2384 33367 695 1230 382 Mar-83 2500 35288 763 1345 283 Feb-83 2312 29876 613 1205 257 Jan-83 2678 35056 709 1253 306 Dec-82 1678 27171 568 962 187 Nov-82 2209 29917 624 915 276 Oct-82 2382 30143 713 239 Sep-82 2315 34771 617 1091 272 Aug-82 2624 36523 724 1108 Jul-82 1745 34693 640 1030 249

6
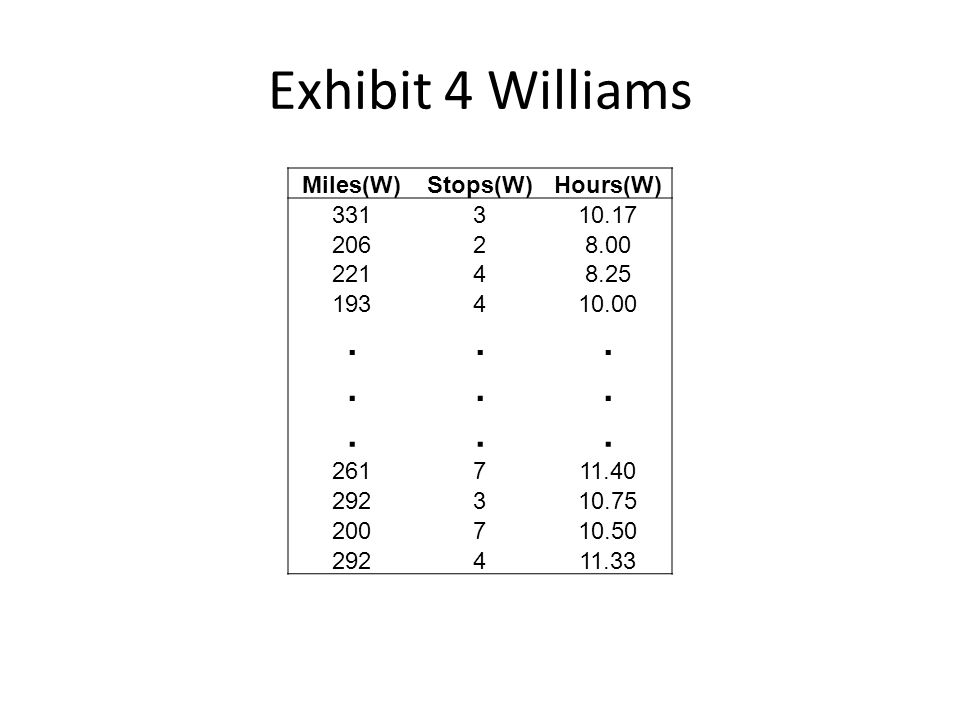
Exhibit 4 Williams . Miles(W) Stops(W) Hours(W) 331 3 10.17 206 2 8.00
221 4 8.25 193 10.00 . 261 7 11.40 292 10.75 200 10.50 11.33
7
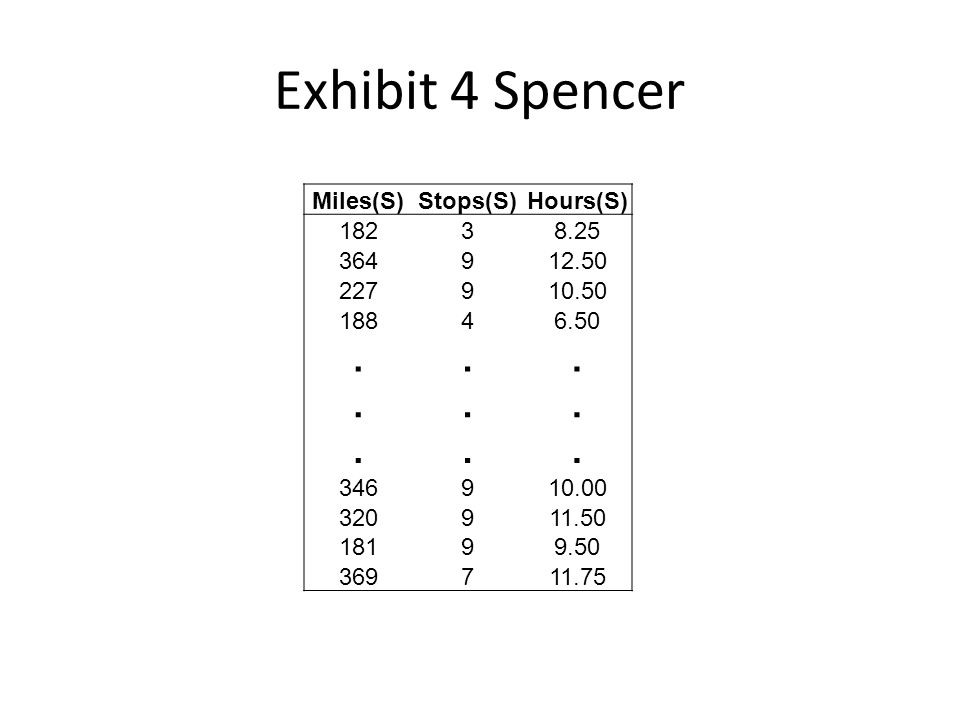
Exhibit 4 Spencer . Miles(S) Stops(S) Hours(S) 182 3 8.25 364 9 12.50
227 10.50 188 4 6.50 . 346 10.00 320 11.50 181 9.50 369 7 11.75
8
Notes

9
Task A Calculate summary statistics for both the Williams and Spencer Data. Be prepared to present and comment BRIEFLY on the results.

10
Task B Test the hypothesis that mean hours is equal for S and W.
Formulate you own alternative hypothesis Do not use regression Be prepared to report and interpret the results.

11
Task C Combine (Stack) the Williams and Spencer Data.
Create a dummy variable which designates driver Regress hours on the dummy variable. Be prepared to interpret the results and to test the statistical significance of the results.

12
Task D Test the hypothesis that Spencer’s mean miles (per run) is equal to Williams’ mean miles. Ha: mean miles for Spencer is greater than mean miles for Williams. Be prepared to interpret the results.

13
Task E Test the hypothesis that Spencer’s mean Stops (per run) is equal to Williams’ mean Stops. Ha: mean Stops for Spencer is greater than mean Stops for Williams. Be prepared to interpret the results.

14
Task F For the Williams Data For the Spencer Data
Regress Hours on both Miles and Stops. Be prepared to report and interpret the results. For the Spencer Data Based on your comparison of the two models, who is the better driver?

15
Task G Combine (Stack) the Williams and Spencer Data.
Create a dummy variable which designates driver. Regress hours on the dummy variable, Miles, and Stops. A multiple regression with three X variables. Be prepared to interpret the results and to test the statistical significance of the results.

16
Edgcomb Metals What Happened

Similar presentations


 7 8 Units.>")


