Download presentation
Presentation is loading. Please wait.

1
© 2004 by David T. Olson Sample - Not for Public Use1 A Sample Presentation of The State of the Church in Colorado and the Front Range 1990-2000 Dave Olson www.TheAmericanChurch.org

2
© 2004 by David T. Olson Sample - Not for Public Use2 The first 19 slides are from the “State of the Church in Colorado” Powerpoint. The Complete Powerpoint is 40 slides in length, and is available at http://www.theamericanchurch.org/state/UCO20.htm. It includes maps of church attendance in every county, as well as denominational charts, average size charts, church planting charts, ethnicity charts and population growth information. http://www.theamericanchurch.org/state/UCO20.htm

3
© 2004 by David T. Olson Sample - Not for Public Use3 In 1996, polls taken immediately after the Presidential election revealed that 58% of people claimed they had voted, when in reality only 49% actually did. This is called the Halo Effect. People tend to over-inflate their participation in activities that create acceptability within their social group. For many decades, pollsters such as Gallup and Barna have reported that around 45% of Americans attend church every Sunday. But there is a religious Halo Effect. Actual attendance counts have shown that the percentage of people attending church on any given weekend is much lower than was previously thought.

4
© 2004 by David T. Olson Sample - Not for Public Use4 The Intent of this presentation is to answer and then expand on two key questions: “How Many People Really Attend Church in Colorado Every Week?” “Is the Christian Church Going Forward or Backwards in Influence in Colorado?” As the data is analyzed county by county assessing a number of factors, a comprehensive picture of the State of the Church in Colorado will begin to take shape.

5
© 2004 by David T. Olson Sample - Not for Public Use5 This study uses weekend church attendance as a more reliable and more immediate snapshot of Christian influence than membership. The following map shows the percentage of the population attending a Christian church on any given weekend in all 50 states in 2000. Colorado has an attendance percentage (15.2%) that is less than the average for the nation (18.7%).
 that is less than the average for the nation (18.7%)..")
6
© 2004 by David T. Olson Sample - Not for Public Use6

7
7 The Next Map shows the percentage of the population attending a Christian church on any given weekend in 2000 for each county in Colorado.

8
© 2004 by David T. Olson

9
© 2004 by David T. Olson Sample - Not for Public Use9 The Next 2 Maps show the population numbers for each county in Colorado. The first map shows the population size of each county. Eleven counties have a population of over 100,000 people. The second map shows the growth or decline in population for each county from 1990 - 2000.

10
© 2004 by David T. Olson Broomfield Colorado - 2000 Population per County Blue = Lowest Maroon = Middle Beige = Highest 558 San Juan 790 Hinsdale 831 Mineral 1,577 Jackson 1,622 Kiowa 1,844 Dolores 2,231 Cheyenne 2,747 Sedgwick 3,503 Custer 3,663 Costilla 3,742 Ouray 4,480 Phillips 4,517 Baca 4,757 Gilpin 4,926 Washington 5,518 Crowley 5,917 Saguache 5,986 Rio Blanco 5,998 Bent 6,087 Lincoln 6,594 San Miguel 7,812 Lake 7,862 Huerfano 8,011 Kit Carson 8,400 Conejos 9,322 Clear Creek 9,841 Yuma 9,898 Archuleta 12,413 Rio Grande 12,442 Grand 13,184 Moffat 13,956 Gunnison 14,483 Prowers 14,523 Park 14,872 Pitkin 14,966 Alamosa 15,207 Las Animas 16,242 Chaffee 19,690 Routt 19,872 Elbert 20,311 Otero 20,504 Logan 20,555 Teller 23,548 Summit 23,830 Montezuma 27,171 Morgan 27,834 Delta 33,432 Montrose 41,659 Eagle 43,791 Garfield 43,941 La Plata 46,145 Fremont 116,255 Mesa 141,472 Pueblo 175,766 Douglas 180,936 Weld 251,494 Larimer 291,288 Boulder 363,857 Adams 487,967 Arapahoe 516,929 El Paso 527,056 Jefferson 554,636 Denver 0 to 10,000 10,000 to 100,000 100,000 to 554,637

11
© 2004 by David T. Olson Broomfield Colorado - 2000 Population Growth per County Blue = Lowest Maroon = Middle Beige = Highest -187 San Juan -166 Cheyenne -66 Kiowa -39 Baca -28 Jackson 14 Rio Blanco 57 Sedgwick 114 Washington 126 Otero 273 Mineral 291 Phillips 323 Hinsdale 340 Dolores 473 Costilla 871 Kit Carson 887 Yuma 947 Conejos 950 Bent 1,136 Prowers 1,298 Saguache 1,349 Alamosa 1,442 Las Animas 1,447 Ouray 1,558 Lincoln 1,572 Crowley 1,577 Custer 1,643 Rio Grande 1,687 Gilpin 1,703 Clear Creek 1,805 Lake 1,827 Moffat 1,853 Huerfano 2,211 Pitkin 2,937 Logan 2,941 San Miguel 3,558 Chaffee 3,683 Gunnison 4,476 Grand 4,553 Archuleta 5,158 Montezuma 5,232 Morgan 5,602 Routt 6,854 Delta 7,349 Park 8,087 Teller 9,009 Montrose 10,226 Elbert 10,667 Summit 11,657 La Plata 13,817 Garfield 13,872 Fremont 18,421 Pueblo 19,731 Eagle 23,110 Mesa 49,115 Weld 65,358 Larimer 65,949 Boulder 87,026 Denver 88,626 Jefferson 96,456 Arapahoe 98,819 Adams 115,375 Douglas 119,915 El Paso -1,000 to 2,000 2,000 to 20,000 20,000 to 120,000

12
© 2004 by David T. Olson Sample - Not for Public Use12 The 2 Next Slides show the ethnicity of Colorado in 1990 and 2000. The third slide shows the growth or decline in the percentage of the population for each ethnic group.

13
© 2004 by David T. Olson Sample - Not for Public Use13

14
© 2004 by David T. Olson Sample - Not for Public Use14

15
© 2004 by David T. Olson Sample - Not for Public Use15

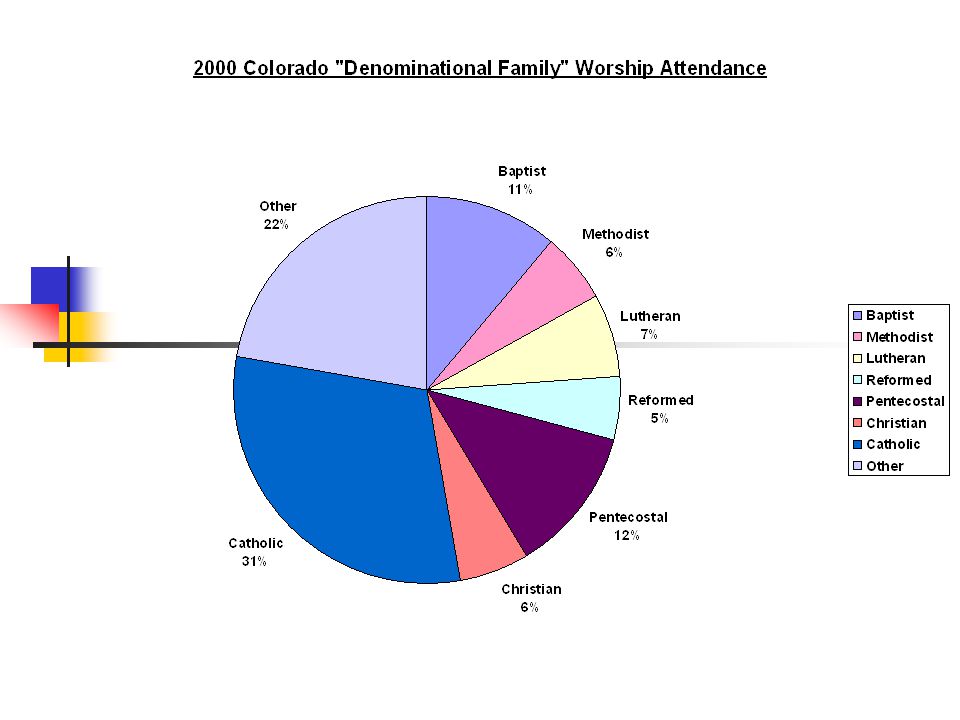
16
© 2004 by David T. Olson Sample - Not for Public Use16 The Next Graph shows the attendance numbers for the churches in Colorado in 1990 and 2000. Most noteworthy is the strong growth of Evangelical churches. Unfortunately, as overall worship attendance has remained grown, the population has grown much more dramatically. A more reliable standard for evaluating increasing or declining influence is the percentage of the population attending church on any given weekend, shown in the second graph.

17
© 2004 by David T. Olson

21
© 2004 by David T. Olson Sample - Not for Public Use21 This Chart shows the net gain in the number of churches in Colorado in the past decade. There was a net gain of 144 churches. However, to keep up with the population growth in Colorado, there would have needed to have been an additional 792 more churches started from 1990 - 2000.

22
© 2004 by David T. Olson

23
© 2004 by David T. Olson Sample - Not for Public Use23 The Complete Colorado Powerpoint is 40 slides in length, and is available at http://www.theamericanchurch.org/state/UCO20.htm. It includes maps of church attendance in every county in the metro area, as well as denominational charts, average size charts, church planting charts, ethnicity charts and population growth information. http://www.theamericanchurch.org/state/UCO20.htm

24
© 2004 by David T. Olson Sample - Not for Public Use24 The next 8 slides are from the “State of the Church on the Front Range” Powerpoint. The Complete Powerpoint is 53 slides in length, and is available at http://www.theamericanchurch.org/metro/FrontRange.htm. It includes maps of church attendance in every county in the metro area, as well as denominational charts, average size charts, church planting charts, ethnicity charts and population growth information. http://www.theamericanchurch.org/metro/FrontRange.htm

25
© 2004 by David T. Olson Sample - Not for Public Use25 The Next 2 Maps show the population numbers for the Front Range. The first map shows the population size of every county. The second map shows the growth in population for every county from 1990 - 2000. The Front Range has the eighth fastest growth rate out of the largest 55 metropolitan areas in the United States, with a decadal growth rate of 30.7%.

26
© 2004 by David T. Olson Sample - Not for Public Use26 Front Range 2000 Population Broomfield 363,857 Adams 175,766 Douglas 527,056 Jefferson 487,967 Arapahoe 554,636 Denver 291,288 Boulder 516,929 El Paso 251,494 Larimer 180,936 Weld

27
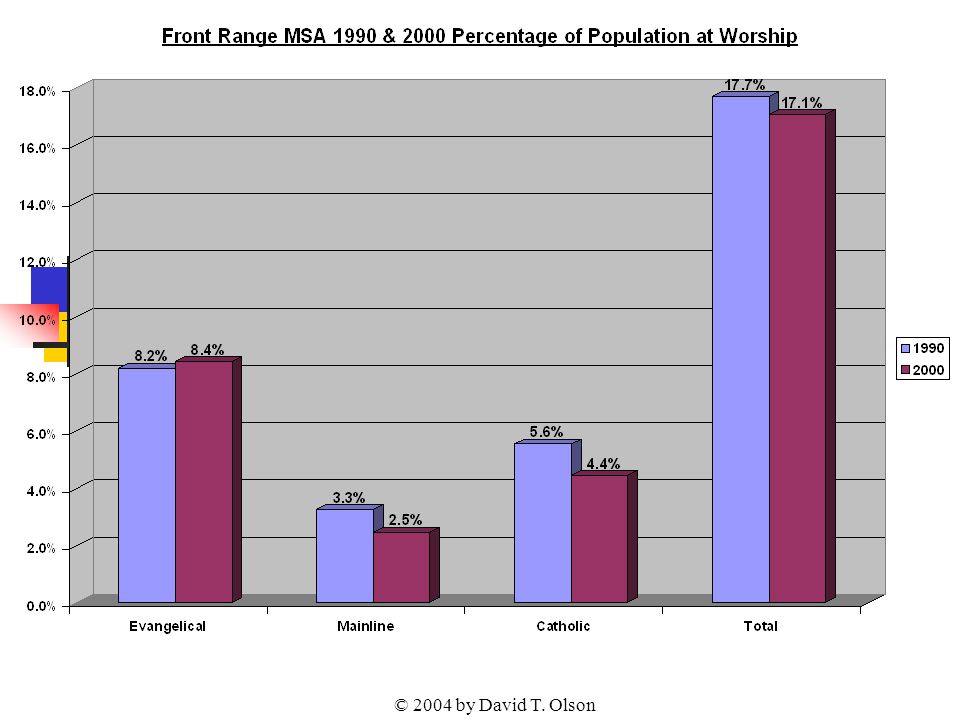
© 2004 by David T. Olson Sample - Not for Public Use27 The Next Graph shows the attendance numbers for the churches in the Front Range in 1990 and 2000. Evangelicals grew rapidly in attendance numbers, while Mainline and Catholic churches stayed stable. As population has grown rapidly, however, a more reliable standard for evaluating increasing or declining influence is the percentage of the population attending church on any given weekend, shown in the second graph.

28
© 2004 by David T. Olson

30
© 2004 by David T. Olson Sample - Not for Public Use30 The Next Chart shows the 1990 & 2000 average church attendance by group for both this metro area and the nation. The second chart shows the 1990 & 2000 population per church for this metro area and the nation. In 2000, Arkansas had the lowest population per church ratio with 411 people per church. Utah had the highest ratio with 4,586 people per church.

31
© 2004 by David T. Olson Sample - Not for Public Use31

32
© 2004 by David T. Olson Sample - Not for Public Use32

33
© 2004 by David T. Olson Sample - Not for Public Use33 The Complete Front Range Powerpoint is 41 slides in length, and is available at http://www.theamericanchurch.org/metro/FrontRange.htm. It includes maps of church attendance in every county in the metro area, as well as denominational charts, average size charts, church planting charts, ethnicity charts and population growth information. http://www.theamericanchurch.org/metro/FrontRange.htm

34
© 2004 by David T. Olson Sample - Not for Public Use34 This Presentation is based on a nationwide study of American church attendance, as reported by churches and denominations. The database currently has average worship attendances for each of the last 10 years for over 200,000 individual churches. It also uses supplementary information (actual membership numbers correlated with accurate membership to attendance ratios) to project the attendances of all other denominational and independent churches. All told, accurate information is provided for over 300,000 orthodox Christian churches. 1 1 This presentation looks only at people attending orthodox Christian churches. Approximately 3 million people attend non-orthodox Christian churches, and perhaps 3 million attend a religious service of another religion. Those ‘houses of worship’ would add another 35,000 churches in the United States and increase the 2000 percentage to 20.5%.
 to project the attendances of all other denominational and independent churches. All told, accurate information is provided for over 300,000 orthodox Christian churches. 1 1 This presentation looks only at people attending orthodox Christian churches. Approximately 3 million people attend non-orthodox Christian churches, and perhaps 3 million attend a religious service of another religion. Those ‘houses of worship’ would add another 35,000 churches in the United States and increase the 2000 percentage to 20.5%..")
35
© 2004 by David T. Olson Sample - Not for Public Use35 For More Information... Please go to www.theamericanchurch.org for additional information on the American Church.www.theamericanchurch.org 12 Surprising Facts about the American Church is available at http://www.theamericanchurch.org/ 12supm. htm http://www.theamericanchurch.org/ 12supm. htm The complete Colorado Powerpoint presentation is available at http://www.theamericanchurch.org/state/UCO20.htm http://www.theamericanchurch.org/state/UCO20.htm The Complete Front Range Powerpoint presentation is available at http://www.theamericanchurch.org/metro/FrontRange.htm http://www.theamericanchurch.org/metro/FrontRange.htm A Combo Pack (12 Surprising Facts, Colorado and Front Range Powerpoints) is available at http://www.theamericanchurch.org/combo/Colorado.htm http://www.theamericanchurch.org/combo/Colorado.htm
 is available at")
Similar presentations


: Demographics of the Uninsured Funded by: Health Resources and.>")


