Download presentation
Presentation is loading. Please wait.

1
Examining the Damaging New England Windstorm of 25-26 February 2010 as a Shapiro-Keyser Cyclone Stacie Hanes/NOAA NWS Gray ME Jim Hayes/NOAA NWS Mount Holly NJ 12 th Northeast Regional Operational Workshop November 3-5, 2010

2
Outline Overview of the event Overview of the event Review of the structure and evolution of a Norwegian and a Shapiro-Keyser cyclone Review of the structure and evolution of a Norwegian and a Shapiro-Keyser cyclone Overview of the synoptic setup prior to the damaging winds Overview of the synoptic setup prior to the damaging winds Use of observational and model data to identify the structure of Shapiro-Keyser cyclone Use of observational and model data to identify the structure of Shapiro-Keyser cyclone

3
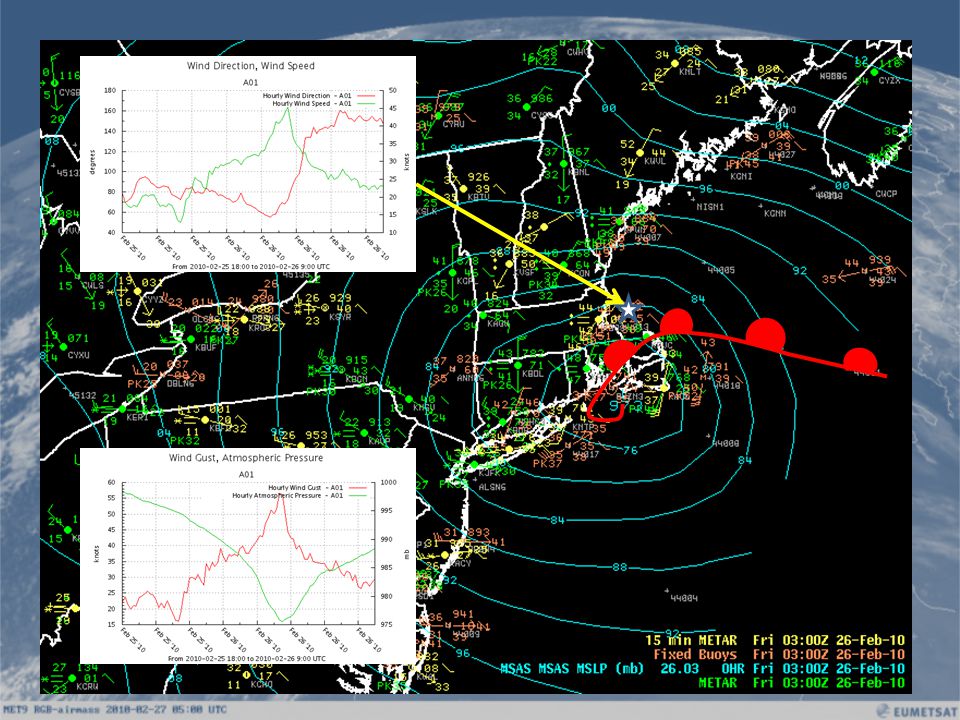
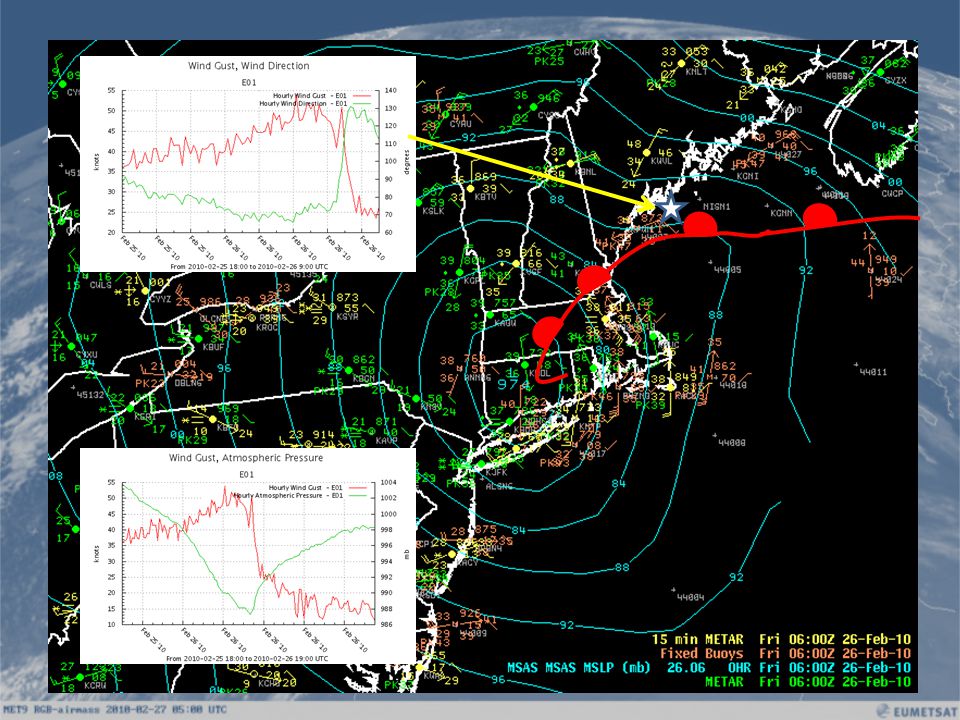
Brief overview of the event East to northeast winds gusted as high as 94 mph during the late evening and overnight of 25-26 Feb 2010 East to northeast winds gusted as high as 94 mph during the late evening and overnight of 25-26 Feb 2010 The strongest gusts occurred with the passage of a surface trough The strongest gusts occurred with the passage of a surface trough Significant damage occurred across southeast New Hampshire and southwest and central Maine Significant damage occurred across southeast New Hampshire and southwest and central Maine This wind event caused the second largest number of power outages ever in New Hampshire

4
Brief overview of the event Three peak wind gusts of over 90 MPH were recorded during this event Three peak wind gusts of over 90 MPH were recorded during this event Portland ME (PWM) had its highest wind gust ever recorded. It may have been higher, but the power failed at the ASOS Portland ME (PWM) had its highest wind gust ever recorded. It may have been higher, but the power failed at the ASOS
 had its highest wind gust ever recorded. It may have been higher, but the power failed at the ASOS.")
5
The highest wind speeds occurred with surface trough between 1100 PM and 200 AM across southeast New Hampshire and southern Maine. Destructive winds from the east or northeast are fairly rare in northern New England, especially at night.

6
Was this the result of a warm front/occluded frontal passage, or something else?

7
Norwegian Cyclone Model Typically the strong winds occur in the warm sector in this cyclone model or on the back side in the cold air advection

8
Norwegian Cyclone Model This cyclone model could account for stronger winds reaching the surface in the “warm sector”, but the low levels appear too stable to allow turbulent mixing in the “cool sector” This model does not explain the destructive winds on the cold side of the warm/occluded front

9
Shapiro-Keyser Model I.Open wave (similar to the Norwegian cyclone model II.Frontal fracture (T bone frontal structure) III.Bent-back front – strong winds on the cold side of the warm front IV.Warm seclusion – evaporative cooling/descent can allow an eye-like feature to develop.
 III.Bent-back front – strong winds on the cold side of the warm front IV.Warm seclusion – evaporative cooling/descent can allow an eye-like feature to develop.")
10
Shapiro-Keyser model Typically develops as a marine cyclone Typically develops as a marine cyclone Generally forms in large scale confluence and a high zonal index flow Generally forms in large scale confluence and a high zonal index flow Characterized by a strong warm front, weak cold front and T bone frontal structure Characterized by a strong warm front, weak cold front and T bone frontal structure

11
Models were fairly close concerning the overall sequence of events. The 1200 UTC 25 Feb 2010 NAM model solution is examined. So now that we have an idea of how the storm should look…what did the models show?

12
1200 UTC 25 Feb 2010 NAM - 0600 UTC (left) and 0900 UTC (right)
 and 0900 UTC (right)")
13
1200 UTC 25 Feb 2010 NAM - 0000 UTC (left) and 0300 UTC (right)
 and 0300 UTC (right)")
14
1200 UTC 25 Feb 2010 NAM - 0600 UTC (left) and 0900 UTC (right)
 and 0900 UTC (right)")
16
Bottom line The NAM was forecasting a highly anomalous event for northern New England The NAM was forecasting a highly anomalous event for northern New England – Many forecast parameters showed departures of 4 to 5 standard deviations – Main time frame was 0300 UTC to 0900 UTC for the forecast area

17
Examining the Shapiro-Keyser cyclone environment using observational tools

18
0015z 26 Feb 2010 IR image – the cyclone is the in bent-back front stage (Stage III)
")
19
0000 UTC 26 Feb 2010 GYX observed sounding The depth of the mixed later is unusual for an easterly flow at night

20
0255 UTC 26 FEB 2010 AMDAR descent sounding at BOS 60 knot wind at 1210 ft.

22
0415z 26 Feb 2010 IR image – the cyclone is the in warm seclusion stage (Stage IV)
")
27
Summary Damaging winds occurred in northern New England during the late evening of 25 February 2010 and the early morning of 26 February 2010 Damaging winds occurred in northern New England during the late evening of 25 February 2010 and the early morning of 26 February 2010 – Damage was caused by east to northeast winds during an unusual time – A few locations had maximum wind gusts over 90 MPH PWM had its high wind gust ever before the ASOS power failed PWM had its high wind gust ever before the ASOS power failed The damaging winds occurred in the cold air ahead of the warm front, which suggests a Shapiro-Keyser cyclone The damaging winds occurred in the cold air ahead of the warm front, which suggests a Shapiro-Keyser cyclone

Similar presentations


 Warm (-31 C)>")


 – description of.>")
