Download presentation
Presentation is loading. Please wait.

1
www.bls.gov A Data Sampler for TAA and Community College Efforts Richard J. Holden Regional Commissioner San Francisco Regional Office

2
Bureau of Labor Statistics What does BLS do? Principal Federal agency responsible for measuring labor market activity, working conditions, and price changes in the economy Principal federal economic indicators for inflation, employment/unemployment, and employment costs Also, produce measures of occupational safety and occupational projections Data used by policymakers, funding, benefits, wage setting, and contracts 2

3
Occupational Employment Statistics (OES) Employment and wages for about 800 occupations Published annually for the nation, states, and metropolitan areas Location quotients which show concentration of occupational employment Used by job seekers and employers to determine salary ranges for different occupations in different locations and in different industries
 Employment and wages for about 800 occupations Published annually for the nation, states, and metropolitan areas Location quotients which show concentration of occupational employment Used by job seekers and employers to determine salary ranges for different occupations in different locations and in different industries")
4
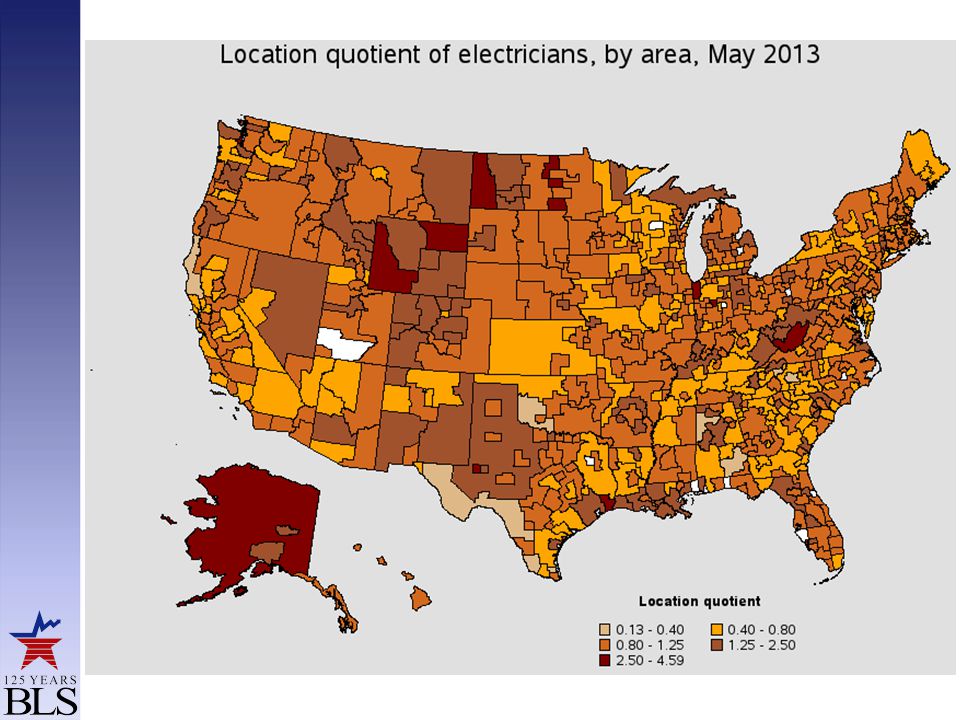
Example of available OES data: Electricians

5
Metro Areas with highest pay for Electricians Data reference date: May 2013 Metropolitan areaEmployment Location quotient Hourly mean wage San Francisco-San Mateo-Redwood City, CA Metropolitan Division 2,2700.53$40.01 Oakland-Fremont-Hayward, CA Metropolitan Division 3,9400.96$38.44 New York-White Plains-Wayne, NY-NJ Metropolitan Division 22,6201.05$37.44 Fairbanks, AK2902.01$36.99 Rockford, IL4000.68$36.18 Anchorage, AK1,2101.68$35.47 Gary, IN Metropolitan Division3,4503.16$34.79 Chicago-Joliet-Naperville, IL Metropolitan Division 15,7001.04$34.76 Portland-Vancouver-Hillsboro, OR-WA5,3801.28$34.72 Redding, CA1800.78$33.89

7
Metro Areas with highest employment of Electricians Metropolitan areaEmployment Location quotient Hourly mean wage New York-White Plains-Wayne, NY-NJ Metropolitan Division 22,6201.05$37.44 Houston-Sugar Land-Baytown, TX15,7801.4$22.65 Chicago-Joliet-Naperville, IL Metropolitan Division 15,7001.04$34.76 Los Angeles-Long Beach-Glendale, CA Metropolitan Division 10,5500.65$30.15 Atlanta-Sandy Springs-Marietta, GA 10,3001.09$22.84 Phoenix-Mesa-Glendale, AZ9,7501.34$20.96 Washington-Arlington-Alexandria, DC-VA-MD-WV Metropolitan Division 9,4600.98$26.69 Dallas-Plano-Irving, TX Metropolitan Division 8,1300.92$20.44 Denver-Aurora-Broomfield, CO7,4101.41$23.62 Boston-Cambridge-Quincy, MA NECTA Division 6,8300.95$32.11 Data reference date: May 2013

9
Location Quotients Ratio of the area’s concentration of occupational employment to the national average concentration Shows the areas in which an occupation is most prevalent relative to the national average Useful tool for analyzing differences in the mix of occupations in states and metropolitan areas

10
Metro Areas with highest concentration of Electricians Metropolitan areaEmployment Location quotient Hourly mean wage Kokomo, IN 5403.26$31.87 Gary, IN Metropolitan Division 3,4503.16$34.79 Odessa, TX 8803.04$20.80 Bremerton-Silverdale, WA 9102.87$27.97 Lowell-Billerica-Chelmsford, MA- NH NECTA Division 1,2802.66$26.48 Beaumont-Port Arthur, TX 1,6602.61$25.93 Casper, WY 4102.36$24.46 Framingham, MA NECTA Division 1,5002.27$28.35 Tuscaloosa, AL 7902.12$23.26 Baton Rouge, LA 3,1202.08$22.30 Data reference date: May 2013

12
Occupations with the highest location quotients in California

13
Occupations with the highest location quotients in San Francisco-Oakland-Fremont

14
OES Data: Where to Find http://www.bls.gov/oes/tables.htm

15
Employment Projections

16
Fastest growing Installation, Maintenance, and Repair Occupations, 2012-2022 Number (in thousands)Percent Medical equipment repairers12.830.3 Commercial divers1.129.4 Bicycle repairers2.725.1 Wind turbine service technicians0.824.5 Mechanical door repairers3.823.8 Riggers3.523.3 Heating, air conditioning, and refrigeration mechanics and installers 55.920.9 Industrial machinery mechanics60.318.9 Millwrights7.218.4 Security and fire alarm systems installers 9.215.9
Percent Medical equipment repairers Commercial divers Bicycle repairers Wind turbine service technicians Mechanical door repairers Riggers Heating, air conditioning, and refrigeration mechanics and installers Industrial machinery mechanics Millwrights Security and fire alarm systems installers")
17
Largest growing Installation, Maintenance, and Repair Occupations, 2012-2022 Number (in thousands)Percent Maintenance and repair workers, general125.29.4 Automotive service technicians and mechanics 60.48.6 Industrial machinery mechanics60.318.9 Heating, air conditioning, and refrigeration mechanics and installers 55.920.9 First-line supervisors of mechanics, installers, and repairers 33.97.8 Bus and truck mechanics and diesel engine specialists 21.68.6 Automotive body and related repairers20.413.3 Helpers--installation, maintenance, and repair workers 17.513.7 Installation, maintenance, and repair workers, all other 14.08.8 Medical equipment repairers12.830.3
Percent Maintenance and repair workers, general Automotive service technicians and mechanics Industrial machinery mechanics Heating, air conditioning, and refrigeration mechanics and installers First-line supervisors of mechanics, installers, and repairers Bus and truck mechanics and diesel engine specialists Automotive body and related repairers Helpers--installation, maintenance, and repair workers Installation, maintenance, and repair workers, all other Medical equipment repairers")
18
Apprenticeship required occupations with largest projected employment increase, 2012-2022 Title Number (in thousands) Percent 2012 median annual wage Insulation workers, mechanical13.546.739,170 Brickmasons and blockmasons25.235.546,440 Stonemasons4.129.237,350 Elevator installers and repairers4.824.676,650 Carpenters218.224.239,940 Reinforcing iron and rebar workers3.623.145,910 Structural iron and steel workers12.721.846,140 Plumbers, pipefitters, and steamfitters82.321.349,140 Terrazzo workers and finishers0.719.839,740 Electricians114.719.749,840 Millwrights7.218.449,510
 Percent 2012 median annual wage Insulation workers, mechanical ,170 Brickmasons and blockmasons ,440 Stonemasons ,350 Elevator installers and repairers ,650 Carpenters ,940 Reinforcing iron and rebar workers ,910 Structural iron and steel workers ,140 Plumbers, pipefitters, and steamfitters ,140 Terrazzo workers and finishers ,740 Electricians ,840 Millwrights ,510")
19
WT Median annual wages, May 2012 NN$65,470 NN$24,420 NS$38,200 NN$41,540 NN$29,370 NN$22,700 NN$27,130 NN$34,500 NN$70,210 NL$43,640 Thousands of jobs, projected 2012-22 Associate’s Degree or Postsecondary Non-degree Award Occupations with the Largest Job Growth 19

20
WT Median annual wages, May 2012 NS$32,410 NS$30,580 NA$39,940 NM$35,170 NM$31,350 NS$19,510 NS$27,470 <5N$49,330 NS$25,990 NM$54,230 Thousands of jobs, projected 2012-22 High School Diploma Occupations with the Largest Job Growth 20

21
WT Median annual wages, May 2012 NS$19,910 NS$21,110 NS$20,820 NS$18,260 NS$22,320 NS$29,990 NS$23,890 NS$19,570 <5M$22,030 NS$23,570 Thousands of jobs, projected 2012-22 Less Than High School Occupations with the Largest Job Growth 21

22
Employment Outlook: 2012-22 Resources for Additional Information 22

23
Occupational Outlook Handbook 23 www.bls.gov/ooh

24
Occupational Outlook Quarterly 24 www.bls.gov/ooq

25
Employment Projections Program 25 www.bls.gov/emp

26
State and Local Area Projections 26 BLS prepares projections only for the nation as a whole Projections of industry and occupational employment are prepared by each state, using input from the BLS national projections State projections data, and links to each state’s projections site, are available http://www.projectionscentral.com/

27
www.bls.gov 415-625-2270 www.bls.gov BLSinfoSF@bls.gov BLS Western Region Information Office Contact Info

Similar presentations


$1,962,970,147.>")


$720,026,497 Median Salary Range$15,440-$129,100.>")


