Download presentation
Presentation is loading. Please wait.

1
COUNTRY ANALYSIS FRAMEWORK

2
Mode of Analysis View country as a unit much like a firm with goals, comparative advantages and measurable outcomes. More complicated as the goals are less obvious, constituencies more varied, and decision making less clear. Examine past & present and project into the future. Must choose time frame of analysis to guide focus.

3
Three Parts Context Strategy Performance

4
Context Background & Resources Players of the Game o Firms: Corporate Sector o Government Actors o Non-state Actors Rules of the Game o Formal Rules o Informal Rules International Dimension

5
Background and Resources Resources Natural Labor Capital Infrastructure Technology Context Rules of the Game Players Background History Culture Demographics Geography Austen, J.E., 1990, Managing in Development Economies Strategy Vision Goals Policies

6
BACKGROUND & RESOURCES

7
HISTORY AND CULTURE

8
Colonial History

9
TRANSITION ECONOMIES Many economies are in the process of building market based economies over the last 25 years.

10
Culture People’s behavior determined by: Human Nature - Universal Personality - Individual Culture - Local View of the world Habits of action Emotional response Hofstede “Cultural Dimensions” Theory Assess by measuring values through surveys

11
World Values Survey WVS conducts international surveys to discover attitudes and values at country level. Ex. Link to Example Questionaire Link

12
Factor Analysis Many questions will be answered in similar ways across questionaires. (i.e. people who answer “Mentioned” to V13 will answer “Mentioned” to V18, etc.) Statistical Theory: There are a small number of independent factors which determine systematic correlations in answers to multiple questions. (plants/chlorophyll). Use statistics to construct clusters of questions and related answers which can be predicted by these factors. Use theory to interpret the dimensions
 Statistical Theory: There are a small number of independent factors which determine systematic correlations in answers to multiple questions. (plants/chlorophyll). Use statistics to construct clusters of questions and related answers which can be predicted by these factors. Use theory to interpret the dimensions.")
13
Link Cultural Values have two dimensions 1. Traditional vs. Secular 2. Survival vs. Lifestyle

14
Atlas of Cultural Values Link

15
Economic background Level of Development Industrial Organization

16
Organization for Economic Cooperation and Development provides information sharing on policies. Limited membership sometimes viewed as synonymous with developed country status. http://www.oecd.org

17
…low-income economies are defined as those with a GNI per capita, calculated using the World Bank Atlas method, of $1,045 or less in 2013; middle-income economies are those with a GNI per capita of more than $1,045 but less than $12,746; high-income economies are those with a GNI per capita of $12,746 or more. Lower-middle-income and upper-middle-income economies are separated at a GNI per capita of $4,125.World Bank Atlas method

18
Measuring the Economy National accounts are the core statistical measure of the economy. Accounts cover many features of the economy but organizing concept is Gross Domestic Product (GDP)
.")
19
Gross Domestic Product (GDP) “GDP combines in a single figure, and with no double counting, all the output (or production) carried out by all the firms, non-profit institutions, government bodies and households in a given country during a given period, regardless of the type of goods and services produced, provided that the production takes place within the country’s economic territory.” L & B p. 15 All goods sold in an economy share a common unit of measure: the price at which they are sold. Sum up the value of goods

20
GDP is a measure of production Value added at production establishment i GDP is the sum of VA across establishments.

21
Economic Concept Value Added is production at firm level due to the combination of capital equipment and workers. Value added is not equal to profits because the costs of worker and capital are not deducted.

22
Accounts are created by national statistical agencies UN System of National Accounts is the “internationally agreed standard set of recommendations” used by most countries. Annual data for many countries available at the UN Link

23
Production Approach Sub-aggregates Divide production establishments into sectors usually along the line of Agriculture: Natural Resources (Agriculture, Forestry, Fishing) Industry: Goods production (Mining, Manufacturing, Utilities, Construction) Services: Trade, Transport, Communication, Services
 Industry: Goods production (Mining, Manufacturing, Utilities, Construction) Services: Trade, Transport, Communication, Services")
24
Hong Kong: Value Added by Sector UN Main Aggregates Link

25
Expenditure Approach Purchase of Final goods by end users are divided into two categories: 1. Consumption: Household expenditure (durables, nondurables & services); government (nondurables & services) expenditure; nonprofit expenditures 2. Investment: Inventories, Fixed Investment (equipment, structures)
; government (nondurables & services) expenditure; nonprofit expenditures 2. Investment: Inventories, Fixed Investment (equipment, structures).")
26
Some Asian Expenditure Shares: 2010 Source: United Nations Main Aggregates DatabaseUnited Nations Main Aggregates DatabaseSource: United Nations Main Aggregates DatabaseUnited Nations Main Aggregates Database People’s Republic of China

27
Demand If we add up the value added at all stages of production we derive the value to the end user. Sum of Final Demand Aggregates equals Sum of Value Added Some demand for domestically produced value added comes from abroad, some domestic demand is satisfied by overseas goods. GDP = Consumption + Investment + Exports – Imports Exports – Imports = External Balance = Trade Balance = Net Exports <> 0

28
Value Added and Income Production establishments are where income is generated. Funds raised can be paid for labor and finance costs, left over money is profit income. Sum of domestic value added (GDP) is equal to wage payments plus financial and profit income referred to as “operating surplus and mixed income.”
 is equal to wage payments plus financial and profit income referred to as operating surplus and mixed income. .")
29
Income Approach to Measuring GDP Value Added distributed as income to Employees, Owner/Creditors, & Gov’t 1. Compensation of employees (Wages, Benefits) 2. Net operating surplus (Profits, Net Interest, Rental Income) 3. Taxes on Production 29
 2. Net operating surplus (Profits, Net Interest, Rental Income) 3. Taxes on Production 29.")
30
National Income vs. Domestic Income Net Factor Income [NFI] is income earned on overseas work or investments minus income generated domestically but paid to foreigners. GNIGDI Gross National IncomeGross Domestic Income = income earned by national residents = income created within domestic borders. GNI = GDI +NFI

31
Source: United Nations Main Aggregates DatabaseUnited Nations Main Aggregates Database

32
NFI Across Countries Source: United Nations Main Aggregates DatabaseUnited Nations Main Aggregates Database

33
Exchange Rate: S - # of domestic currency units purchased for 1 US$. An increase in S is a depreciation of domestic currency and a decrease in S is an appreciation. Exchange Rates

34
Atlas Conversion Method Exchange rates are volatile, so convert to US dollars using S ATLAS = 3 year average.

35
Industrial Structure

36
Economic Orientation

37
RESOURCES

38
Link to CIA Factbook

39
Human Resources Hong KongSingapore

40
Rapid Immigration to Singapore World Bank Jobs Database

41
Barro, Robert and Jong-Wha Lee, "A New Data Set of Educational Attainment in the World, 1950-2010." Journal of Development Economics, vol 104, pp.184- 198."A New Data Set of Educational Attainment in the World, 1950-2010." Education Data

42
INSTITUTIONS

43
The game Players of the Game o Government Actors o Political Leaders o Government Departments o Firms: Corporate Sector o Non-state Actors

44
Link

45
Corporate Sector Informal Sector Small & Medium Enterprise Sector State Owned Enterprise Sector Multi-national Enterprises Business Groups

46
SME Contribution 2003 LinkLink Small and Medium Enterprises across the Globe, Meghana Ayyagari, Thorsten Beck and Asli Demirgüç-Kunt, World Bank Most up-to-date data: LinkLink

47
Corporate Sector MNC’s vs. Business Groups vs. SOE Multi-national Corporations: Geographically diverse, but industrially concentrated. Business Groups: Geographically concentrated but industrially diverse. A dominant model in emerging markets and developing economies. Forbes Global2000

48
State Owned Enterprises Preferential access to finance Run on a policy, non-commercial basis, may Engage in activities that boost economy-wide productivity Support subsidized consumer prices or employment. State owns 10% of shares sometimes used as a definition p. 28

49
Figure 2. Country SOE Share for selected 38 economies Link Share of SOE’s among Top 10 companies (sales, assets, value)Link
Link.")
50
Sovereign Wealth Funds Link

51
Non-government Actors Political parties & movements Religious groups

52
Rules of the Game Formal Constitution, Type of Legal system Property Rights Link

53
World Bank Jobs Database

55
Link

56
Rules of the Game Informal Unwritten practices Business/work culture

57
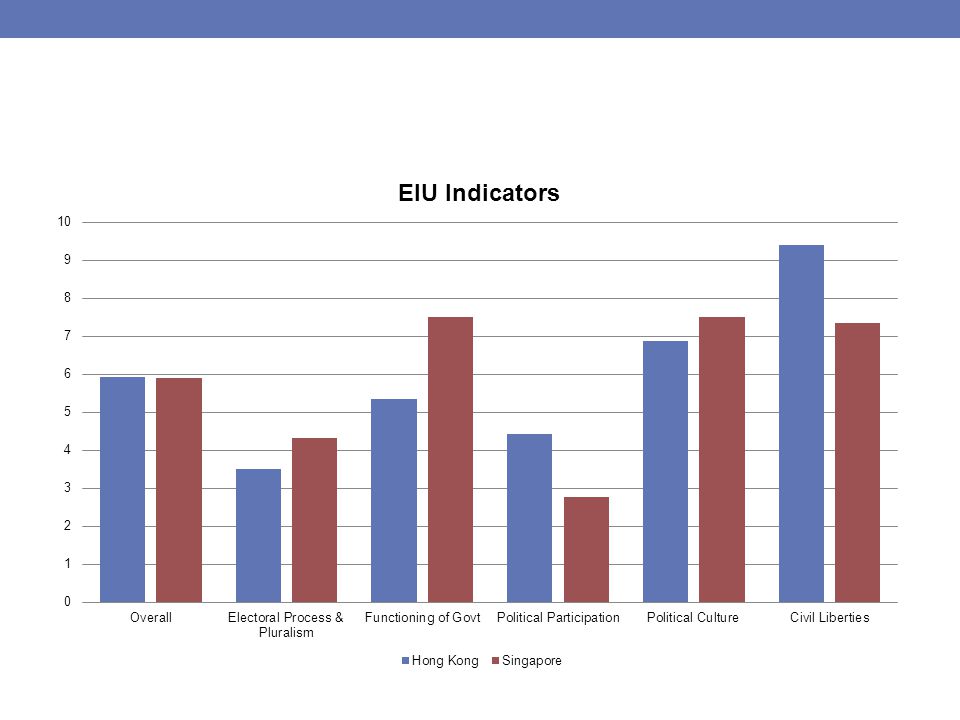
Link Control of Corruption (CC) – capturing perceptions of the extent to which public power is exercised for private gain, including both petty and grand forms of corruption, as well as "capture" of the state by elites and private interests.
 – capturing perceptions of the extent to which public power is exercised for private gain, including both petty and grand forms of corruption, as well as capture of the state by elites and private interests.")
58
2013 Results Link

59
Strategy Vision - Overall view of society Ideology Orientation Goals Policies

60
Orientation Dimensions of Analysis o Market Implementation vs. Government Control o Externally Oriented vs. Internally Oriented o Business Oriented vs. Labor Oriented

61
Link

62
IMF Fiscal Monitor 2013

63
Link

64
Labor Orientation Hong KongSingaporeGermanySpainUSA Notice period for redundancy dismissal (for a worker with 5 years of tenure, in salary weeks)4.334.008.672.140.00 Minimum wage for a 19-year old worker or an apprentice (US$/month)0.00 1145.471043.961242.58 Paid annual leave for a worker with 5 years of tenure (in working days)10.0011.0024.0022.000.00 Retraining or reassignment obligation before redundancy?0.00 1.000.00 Weeks of severance pay for redundancy of experienced workers5.800.0043.3352.000.00 World Bank Jobs Database
 Minimum wage for a 19-year old worker or an apprentice (US$/month) Paid annual leave for a worker with 5 years of tenure (in working days) Retraining or reassignment obligation before redundancy Weeks of severance pay for redundancy of experienced workers World Bank Jobs Database")
65
STRATEGY DOCUMENTS

67
The dedicated chapter clearly sets out, among other things, the Central Authorities' support for Hong Kong – to consolidate and enhance its competitive advantages, including consolidating and enhancing Hong Kong's status as an international centre for financial services, trade and shipping; and in particular, the support for Hong Kong's development as an offshore Renminbi centre and an international asset management centre; to nurture its emerging industries and develop the six industries where Hong Kong enjoys clear advantages to widen their co- operation areas and scope of services; and to deepen economic co-operation with the Mainland and continue to implement CEPA. It also confirms the significant functions and positioning of Hong Kong's co-operation with Guangdong under the Framework Agreement on Hong Kong/Guangdong Co-operation, including the establishment of a financial co-operation zone and a world-class metropolitan cluster with Hong Kong's financial system taking the lead, and the support for Guangdong to open up its service industries for Hong Kong on a pilot basis and extending the pilot scheme to other regions gradually. Link

68
Synthesis Construct a story that uses the different elements to describe the situation faced by the country.

69
No perfect system for describing a country’s situation. This system offers a straight-forward, easily comparable framework. Country-level approach may also be questioned. Any country has many individual actors which will each have their own objectives, strategies and performance measures.

70
MEASURING ECONOMIC PERFORMANCE

71
Readings Lequiller François and Derek Blades, 2006, Under standing NATIONAL ACCOUNTS, Organization for Economic Cooperation and Development, Chapter 1 and 2. LinkLink Bureau of Economic Analysis “Introduction to the National Income and Product Accounts” LinkLink

72
Using GDP to Measure Economic Performance

73
Measuring stick of value is prices of goods in terms of money, but arbitrary changes in the stock of money arbitrarily change prices/the measure of value over time. Comparing value across time requires abstracting from those arbitrary changes in value.

74
What is Economic Growth in a world of many goods? We need to combine the many goods produced or consumed in an economy into one measure. + + + + =?

75
Value vs. Volume Consider the sales of a hypothetical single good k (for example, k = apples). Dollar Value of sales (called v k ) is the product of the volume of goods sold (called q k ) measured in the goods natural units (i.e. bushels of apples) and the dollar price per good (called p k ) v k = p k *q k Growth of value can be decomposed into growth of volume and growth in prices.
 is the product of the volume of goods sold (called q k ) measured in the goods natural units (i.e. bushels of apples) and the dollar price per good (called p k ) v k = p k *q k Growth of value can be decomposed into growth of volume and growth in prices..")
76
Share of Value We could measure total value for the economy. Divide our economy into K categories of goods indexed by k = 1,…, K. Value of sales of good k, v k. GDP is represented as the sum of value across goods

77
Value weignts and Inflation Vectors The weight of k in the economy could be defined as which adds up to 1 across sectors. Identify inflation tendency for that sector for every type of good at time t. Calculate an inflation vector representing the growth rate of prices.

78
Notes on Price Indices: New Goods Weights change as production structure of the economy changes Market baskets used to construct don’t need to stay the same over long-periods. K categories of goods don’t need to stay the same over long periods. New goods can be introduced as long as matched goods are compared in every t and t-1 period.

79
Real GDP Growth Growth of value can be decomposed into growth of volume and growth in prices. We could construct a weighted average

82
Comparisons

83
Inflation We also decompose the growth of the aggregates into growth in prices (inflation) and growth in volume (output).
 and growth in volume (output).")
85
Gross Growth Rate The gross growth rate is equivalent to the ratio of todays goods valued at yesterdays prices to yesterdays good valued at yesterdays prices..

86
Value of Goods measured in constant prices 1. Choose Base year. RGDP Base = GDP Base 2. Calculate the value of goods in the next year using the increase in value. The level of RGDP is measured at constant prices. 3. Repeat. 4. Invert for periods before.

Similar presentations


![BALANCE OF PAYMENTS. National Income vs. Domestic Income Net Factor Income [NFI] is income earned on overseas work or investments minus income generated.](/13/3931586/big_thumb.jpg "BALANCE OF PAYMENTS. National Income vs. Domestic Income Net Factor Income [NFI] is income earned on overseas work or investments minus income generated.>")
.>")


