Download presentation
Presentation is loading. Please wait.

1
Tutorial on Tukey Charts Farrokh Alemi, Ph.D. Sunday, 11/25/2007

3
Why Chart Data? To discipline intuitions –Only points outside the limit are real changes To communicate data in vivid graphical ways

4
Steps in Creating a Chart 1.Check assumptions & select time period 2.Calculate Median and Fourths 3.Calculate Fourth Spread 4.Calculate control limits 5.Plot observations and control limits 6.Interpret findings 7.Distribute control chart

5
Step 1: Check Assumptions Observations must be measured on an interval scale. There must be at least 7 observations in the time period where control limits are calculated

6
Separate Pre & Post Intervention Data

7
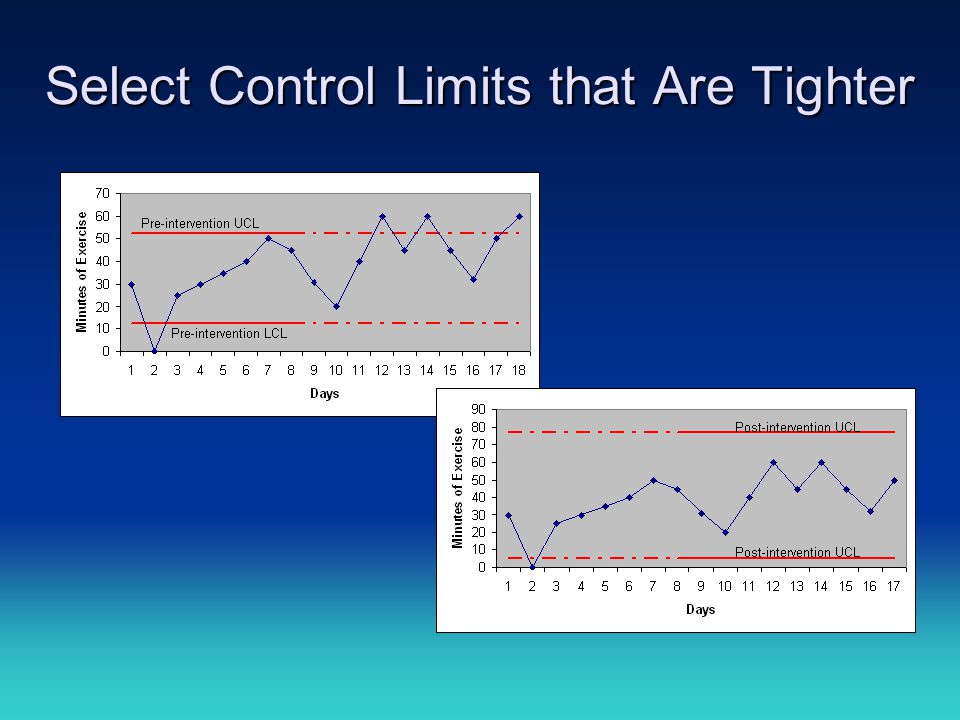
Select Control Limits that Are Tighter

11
Step 2: Calculating Limits UCL = Upper Fourth + 1.5 * Fourth Spreads LCL = Lower Fourth – 1.5 * Fourth Spreads Upper Fourth is value where ¼ of data above it Lower Fourth is value where ¼ of data below it Fourth Spread is difference of Upper and Lower Fourths

12
Calculating Median Median is a value where 50% of data are below if and & 50% above it. List observations from smallest to largest –If odd number of observations, take the data point in the middle, where 50% of data are below it. –If even number of observations, take average of the two middle ranked numbers.

13
Calculating Limits by Using Median 1.List values from smallest to largest 2.Calculate median, divide the data into two halves If Median is one of the data points, include it in both the upper and lower half of data 3.Lower Fourth is the Median of lower half of data 4.Upper Fourth is the median of the upper half of the data 5.Fourth Spread is the difference between the two Fourths 6.Calculate limits as: LCL = Lower Fourth - 1.5 * Fourth Spread UCL = Upper Fourth + 1.5 *Fourth Spread No need for Calculator

14
Example: Exercise Data Pre- intervention

15
Analysis of Exercise Data: Step 1 Median Upper half of data Lower half of data Two halves both include Median because it is an observed data point

16
Analysis of Exercise Data: Step 2 Lower Fourth is Median of lower data set, it is a value between 25 & 30, so it is 27.5

17
Analysis of Exercise Data: Step 3 Upper Fourth is Median of upper data set, it is a value between 35 & 40, so it is 37.5

18
Analysis of Exercise Data: Step 4 Fourth Spread = 37.5-27.5 = 10 UCL = 37.5+1.5*10 = 52.5 Upper Fourth Fourth Spread

19
Analysis of Exercise Data: Step 4 Fourth Spread = 37.5-27.5 = 10 LCL = 27.5-1.5*10 = 12.5 Lower Fourth Fourth Spread

20
Control Chart for Exercise Data

21
Example Data: Budget Deviations

22
Analysis of Budget Data: Step 1 Sort the data from lowest to highest value

23
Analysis of Budget Data Continued Median Upper Half Lower half Lower Fourth is Median of lower half and is -4.5 Upper Fourth is Median of upper half and is 23.5 Fourth spread is 23.5 minus -4.5 = 29 UCL is 23.5 + 1.5 * 29 LCL is -4.5 - 1.5* 29

24
Control Chart for Budget data

25
Take Home Message Tukey Chart can work with small number of data points with no assumptions regarding data distribution

Similar presentations


 we are interested in how to describe the entire set without listing all the elements.>")