Download presentation
Presentation is loading. Please wait.

1
PES photoelectron spectroscopy

2
How does PES work? PES works on the same principle as the photoelectric effect.

3
Photoelectric Effect of visible light http://hyperphysics.phy-astr.gsu.edu/hbase/mod1.html

5
The photon has energy larger than the binding energy (E b ) of the atoms specific electron. The photon typically used with PES is The ejection of an electron produces a positive ion. Uv light or x-ray.

6
core electrons valence electrons UV (h ) Decreasing Binding Energy E k = h – E b ejected valence electron (e-) Ultraviolet Photoelectron Spectroscopy E b = h – E k E k = kinetic energy E b = binding energy
 Decreasing Binding Energy E k = h – E b ejected valence electron (e-) Ultraviolet Photoelectron Spectroscopy E b = h – E k E k = kinetic energy E b = binding energy")
7
core electrons valence electrons X-ray (h ) Decreasing Binding Energy E k = h – E b ejected core electron (e-) X-ray Photoelectron Spectroscopy E b = h – E k E k = kinetic energy E b = binding energy
 Decreasing Binding Energy E k = h – E b ejected core electron (e-) X-ray Photoelectron Spectroscopy E b = h – E k E k = kinetic energy E b = binding energy")
8
Useful Unit Conversions MJ = megajoule (this unit is a 1000x greater than kilo)
")
9
The excess energy is carried off by the electron ejected in the form of kinetic energy The binding energy (energy required to remove this electron) from the atom is equal to the difference between the energy of the radiation absorbed by the atom (hv) and the E k of the ejected photoelectrons. Absorbed energy from the photon KE of the ejected photoelectron E b = hv – E k

10
The values of binding energy found reveal information about the elements present and the orbitals from which the electrons were ejected Lower binding energies are seen for valence electrons, higher binding energies are seen for core electrons For molecules, correlation tables are available to identify the atomic composition of a molecule based on the binding energies of the photoelectrons observed

11
Skoog, Holler, Crouch, “Principles of Instrumental Analysis,” 6 th Ed. p 593. For molecules, correlation tables are available to identify the atomic composition of a molecule based on the binding energies of the photoelectrons observed

12
Data is obtained as peaks in a spectrum. Two common ways to label the x-axis The spectrum can be plotted so that energy increases toward the left (typically) or right, on the x-axis. Peak height is directly proportional to the number of electrons of equivalent energy ejected.
 or right, on the x-axis. Peak height is directly proportional to the number of electrons of equivalent energy ejected..")
13
If you see two peaks with a relative height difference of 2:1 the conclusion is the taller peak contains 2x the number of electrons.

14
Hydrogen has 1 peak in the PES scan above because it has 1 electron. (1s 1 ) The peak measures 1.312 MJ/mol (1312 KJ/mol) This is the energy required to eject the electrons from one mole of hydrogen atoms.
 The peak measures MJ/mol (1312 KJ/mol) This is the energy required to eject the electrons from one mole of hydrogen atoms..")
15
Helium has one peak (1s 2 ) It is shifted to the left as compared to hydrogen’s peak. The peak measures 2.372 MJ/mol It takes more energy to remove an electron in the He atom vs H atom. The peak is 2x that of hydrogen …..consistent with 2e- in He (both H and He have electrons in n=1)
.")
16
Lithium has 2 peaks (1s 2 2s 1 ) The smaller peak represents the 2s 1 electron. It requires 0.52 MJ/mole to remove one mole of electrons. The larger peak represents the 1s 2 core electrons. It is twice the size as the smaller peak (correlating with the concept that twice the peak size, twice the number of electrons). Both electrons require 6.26MJ/mol energy to be released. Energy is not represented by the peak size. It relates to the electron location within the atom. These electrons are closer to the nucleus (core electrons)
. Both electrons require 6.26MJ/mol energy to be released. Energy is not represented by the peak size. It relates to the electron location within the atom. These electrons are closer to the nucleus (core electrons).")
17
Beryllium has 2 peaks (1s 2 2s 2 ) 1:1 ratio both are of similar size The peak to the right is of lesser energy 0.90 MJ/mol(valence shell electrons n=2) compared to the inner peak measuring 11.5 MJ/mol (core electrons n=1). Once again the peaks are similar in size (both contain two electrons). But the energy varies due to location within the atom.
. But the energy varies due to location within the atom..")
18
2:1 ratio of electrons n=2n=1 Boron

19
PES summary PES determines the energy needed to eject electrons Which is called the binding energy (ionization energy). The PES data reinforces the shell model of the atom and infers the electronic structure of atoms. PES scans support the idea that electrons in n=2 occupy different subshells (s, p), n=3 (s, p, d) and n=4 (s, p, d, f)
, n=3 (s, p, d) and n=4 (s, p, d, f).")
20
The peaks in n=1 and n=2 (He and Be respectively) are similar in size proving 2 electrons are present in the two different PELS. The difference in binding energy is a function of nuclear charge. It takes more energy to remove an electron from n=2 than n=3. And even more energy from n=1. Within any subshell it always takes the most energy to remove an electron from the s subshell.

21
So our expectation- It takes more energy to remove an electron from n=2 than n=3. And even more energy from n=1 Q: Do all electrons in a given shell have the same energy? A:No…Electrons within a specific sublevel (s,p,d,f) have similar energies.
 have similar energies..")
22
Simulated photoelectron spectra for some common elements http://www.chem.arizona.edu/chemt/Flash/photoelectron. htmlhttp://www.chem.arizona.edu/chemt/Flash/photoelectron. html Useful Web Sites http://www.bozemanscience.com/ap- chem-004-coulombs-law/http://www.bozemanscience.com/ap- chem-004-coulombs-law/ A complimentary lesson on PES

23
Sulfur 2p Binding Energies Skoog, Holler, Crouch, “Principles of Instrumental Analysis,” 6 th Ed. p 597.

24
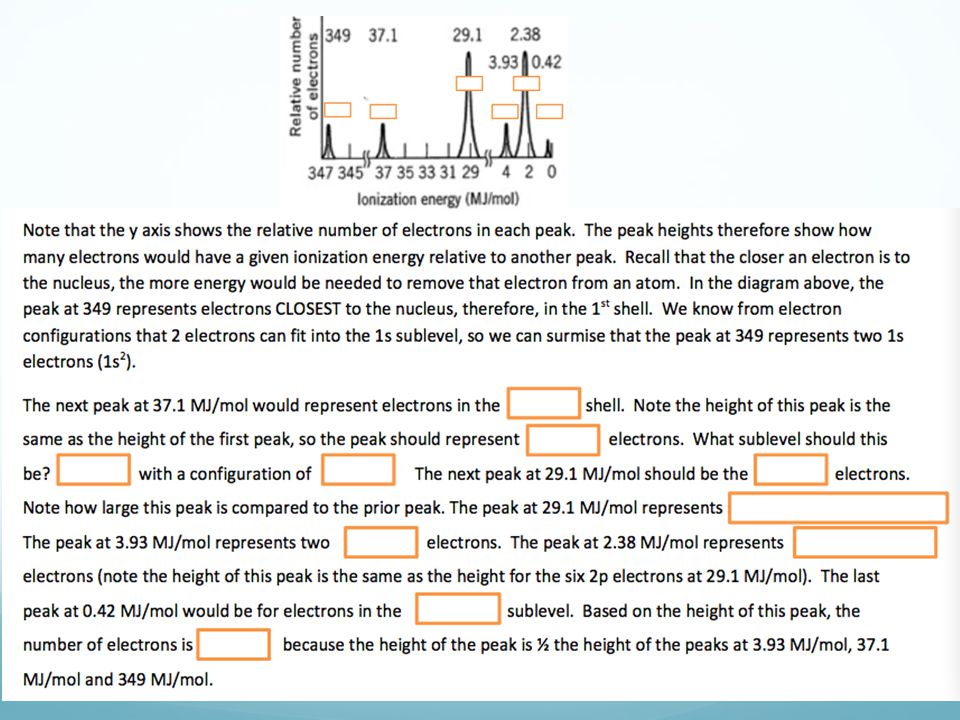
Label the sublevels

Similar presentations


 r(t) Band structure The higher the BO: i) the deeper the Well, ii) the wider the spacing.>")

>")

 Provides data for ionization energy trends and applications Mass Spectrometry Provides atomic/molar.>")


