Download presentation
Presentation is loading. Please wait.

1
Arizona Statewide Post School Outcomes (PSO) Survey Results Summer 2014 Collection SY 2012–13 Exiters
 Survey Results Summer 2014 Collection SY 2012–13 Exiters")
3
July through September 2014 Survey Participants 53 PEAs (districts and charter schools) were included in the reported data Per SAIS, the total number of exiters (youth who graduated, aged out, or dropped out) who were eligible to take the PSO Survey = 1,629 Total number of exiters who responded to the PSO Survey = 1,088
 were included in the reported data Per SAIS, the total number of exiters (youth who graduated, aged out, or dropped out) who were eligible to take the PSO Survey = 1,629 Total number of exiters who responded to the PSO Survey = 1,088")
4
The Three R’s of the PSO Response Rate Representativeness Results

5
Response Rate and Representativeness Arizona 2012–2013 Exiters Arizona Eligible for survey1,629 Respondents1,088 Response Rate67% Represented Under- represented Over- represented Gender (Female) Ethnicity (Minority) Exit Reason (Dropout) Categories of Disability: Represented Under- represented Over- represented LD ED ID All Others
 Ethnicity (Minority) Exit Reason (Dropout) Categories of Disability: Represented Under- represented Over- represented LD ED ID All Others")
7
full- or part-time community college (two-year program) college/university (four- or more year program) one complete term Higher Education pay at or above the minimum wage setting with others who are nondisabled 20 hours a week for at least 90 days (includes military) Competitive Employment
 college/university (four- or more year program) one complete term Higher Education pay at or above the minimum wage setting with others who are nondisabled 20 hours a week for at least 90 days (includes military) Competitive Employment")
8
full- or part-time at least one complete term education or training program (e.g., Job Corps, adult education, workforce development program, or vocational technical school that is less than a two- year program) Other Postsecondary Education or Training work for pay or self-employed at least 90 days includes working in a family business (e.g., farming, working in a store, fishing, ranching, catering services) Other Employment
 Other Postsecondary Education or Training work for pay or self-employed at least 90 days includes working in a family business (e.g., farming, working in a store, fishing, ranching, catering services) Other Employment")
9
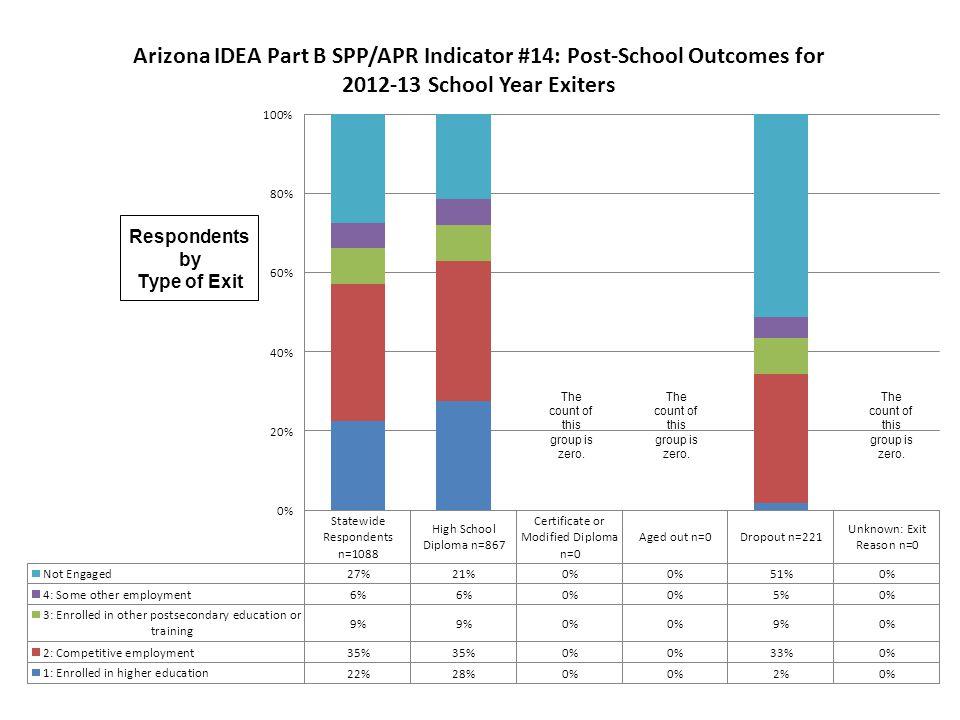
Results by Subgroups Subgroups for OSEP-required reporting: o Gender o Category of Disability o Ethnicity o Type of Exit

14
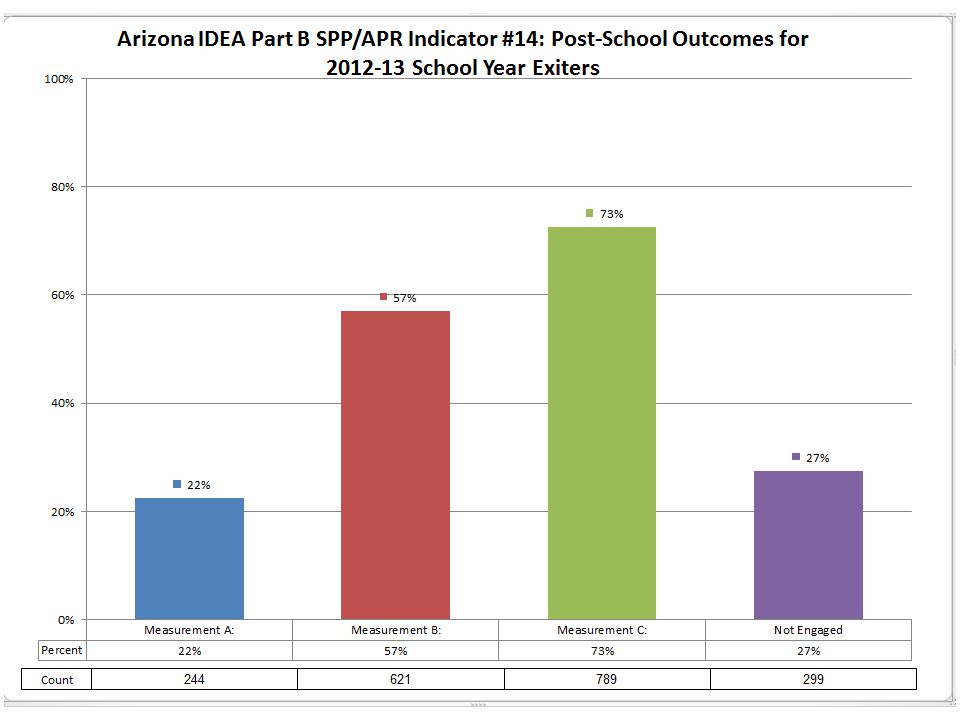
“Unengaged” Characteristics Of the 299 individuals counted in the non-engaged category, 218 did not attempt any postsecondary education/training or employment. However, 81 respondents (27%) indicated that they attempted postsecondary education/training or employment but did not meet the criteria to be counted in an engagement category. If those 81 youth who attempted engagement had been successful, Arizona’s “Measurement C” (engagement rate) would have increased from 73% to 80%.
 indicated that they attempted postsecondary education/training or employment but did not meet the criteria to be counted in an engagement category. If those 81 youth who attempted engagement had been successful, Arizona’s Measurement C (engagement rate) would have increased from 73% to 80%..")
15
Engagement Trends Higher Education

16
Engagement Trends Higher Education + Competitive Employment

17
Engagement Trends All Four Categories

18
Key Findings Key findings from FFY 2013 compared to FFY 2012 findings: 6% increase in overall engagement rate (67% to 73%) 11% increased engagement of youth with a specific learning disability (69% to 80%) Overall engagement rate for youth with ID fell from 54% to 35% (19% decrease). Youth who are identified as American Indian or Native Alaskan showed a 9% increase in overall engagement (40% to 49%).
..")
19
How to Access Local PSO Data

20
PSO Application – Currently Accessed Through ADE Common Logon* Go to the ADE website: http://www.azed.gov/ and click on “ Common Logon”http://www.azed.gov/ *Note: coming soon, the PSO Application will be accessed through ADEConnect

21
Log in to ADE Common Logon with Your User Name and Password

22
Select: Post School Outcomes Survey

23
Logon or PSO Permission Issues? Send an e-mail to: PSOInbox@azed.govPSOInbox@azed.gov Subject: PSO Access Problem Indicate the name of the school or district for which access is needed. Provide the name and e-mail address for the person who needs access to the PSO application. Indicate if the individual needs access for a particular school or districtwide (all schools). Request for access should be initiated by the district special education director.
. Request for access should be initiated by the district special education director..")
24
PSO Application Home Page PSO Home Page helpful resources

25
Select “Reports” from the Menu Bar at the top of the PSO Application Home Page

27
Reports You Will Want to Use Response Rate/Representativeness reveals whether respondents were similar in demographics to total number eligible. Responses by Subcategories provides information about who responded to the survey. Results by Subcategories specifies the outcomes of survey participants by category of disability, ethnicity, gender, and method of exit. Measurements identifies survey respondents (by number and %) engaged in higher education, higher education or competitive employment, and higher education or competitive employment or some other education/training or employment. Non-Engaged specifies number of students who attempted engagement.
 engaged in higher education, higher education or competitive employment, and higher education or competitive employment or some other education/training or employment. Non-Engaged specifies number of students who attempted engagement..")
28
Select Run Report Be sure to select the desired exit year!

30
All Reports can be Exported Click here to see drop-down menu options for exporting the report. Select the desired export option from the list.

34
For More Information/Assistance with Accessing Local Reports Attend or request a webinar training. Consult the ADE PSO website: http://www.azed.gov/special-education /special-projects/secondary-transition /post-school-outcomes-surveyhttp://www.azed.gov/special-education /special-projects/secondary-transition /post-school-outcomes-survey. E-mail: Lorrie.Sheehy@azed.gov.Lorrie.Sheehy@azed.gov

Similar presentations


 Indicator #14 Post School Outcomes Study Cohort III: 2012-2013 Exiters Technical Assistance Session #2 Presented by The New.>")


 with the.>")


 and Family Outcomes (C-4) Analysis and Summary Report of All States’ 2008-2009 Annual Performance Reports Christina.>")


 in the ‘Chat Box’ on the left. 2.CCTS will conduct a sound check.>")


