Download presentation
Presentation is loading. Please wait.

1
Strategic option for updating child growth Standards Dr AKDutta Director Professor & HOD Dept. of Pediatrics Lady Hardinge Medical College & Kalawati Saran Children’s Hospital New Delhi

2
Sub Headings Uses of growth charts Evolution Currently available growth charts Comparison of their features Recommendation for use in our country

3
Growth charts Consist of a series of percentile curves that illustrate the distribution of selected body measurements in the study population Used to track the growth of children from infancy thru adolescence Indicates the state of the child's health, nutrition and well being

4
Growth monitoring By using growth charts-screening tool for diagnosis of nutritional, chronic systemic and endocrine diseases Individual growth monitoring in children in India-Is it possible to achieve? Who shall use the growth charts? Pediatricians? Family Physicians? Anganwadi workers? ASHA?

5
Need for growth charts Individual level Community level National level Scientists Monitoring &documenting growth Comparison with references std To detect growth faltering Monitoring health status Performance of programs Comparison over time Identification of problem areas National/international comparisons Research tool

6
Community level Early identification of children’s growth failure for detection of malnutrition and taking appropriate interventions Early identification-overweight/obesity Sensitize health workers Educate parents and allay their anxiety by showing normal growth in chart

7
Community level Measurements required: Weight Length/Height Head circumference < 2 years Anthropometric indices: Length / stature for age Weight for age Weight for length /stature BMI for age Head circumference for age Length, wt, BMI in relation to pubertal stage

8
What needs to be monitored at community level First 2 years 2 –10 years >10 years Length/age Weight/age Weight /height or BMI Head circumference/age Height/age Weight/age BMI/age Above in relation to pubertal development

9
Earlier available growth charts: Harvard standards Reference data from Boston children’s hospital Hospital based Longitudinal study Small sample size Top fed babies Still served the purpose of creating an awareness re need for monitoring & growth assessment Used in Indian growth charts & for classification of malnutrition since mid 1970s (50 th centile taken as 100%)
")
10
Earlier available growth charts:ICMR Standards Banik Dutta et al: ICMR Technical report series no. 18, 1972: Growth & Physical development of Indian infants & children Not affluent population, but mixed group Community based Criticised for method of sample selection & data collection

11
Charts/Standards currently available Indian : Dr KN Agarwal CDC 2000 WHO

12
Dr KN Agarwal growth standards 0 - 6 years (Indian Pediatrics,1994) Study years 1985-1987 Design Mixed-longitudinal study/ cross-linked data collection Minimum of three readings for each child Cohort a)Birth to first year of age: 418 boys, 332 girls b)12 - 60 months: 1011 boys and 874 girls Sample zones Bangalore, Calcutta, Delhi, Ludhiana, Kota & Varanasi
 Study years Design Mixed-longitudinal study/ cross-linked data collection Minimum of three readings for each child Cohort a)Birth to first year of age: 418 boys, 332 girls b) months: 1011 boys and 874 girls Sample zones Bangalore, Calcutta, Delhi, Ludhiana, Kota & Varanasi")
13
Dr KN Agarwal growth standards 5 - 18 years (Indian Pediatrics-1992 & 2001) Study years: 1988-1991 Design: cross-sectional study minimum of 200 children at each age and sex point. Sample size: 12,893 male & 10,941 female (23 schools) Sample Zones (9 states): North - Delhi, Shimla, Dehradun, Nainital West-south - Bombay,Madras, Udaipur Central - Lucknow Allahabad, Varanasi East – Calcutta, Dhanbad
 Sample Zones (9 states): North - Delhi, Shimla, Dehradun, Nainital West-south - Bombay,Madras, Udaipur Central - Lucknow Allahabad, Varanasi East – Calcutta, Dhanbad.")
14
Dr KN Agarwal ref. standards available: birth – 66 months 6-18 years Height, weight: both sexes 3 monthly interval till 1 year, then 6 monthly 3 rd - 97 th centile -3SD - +3 SD Height, weight: both sexes 6 monthly interval 3-97 th centile Mean & SE

15
Dr KN Agarwal ref. standards available Head circumference BMI Each sex birth to 6 years 3 monthly interval for 1yr, then 6 mthly 3 rd -97 th centile - 3SD to +3 SD 2-18 years Yearly 5 th –95 th centile Mean And SD Each sex

18
Useful upto

23
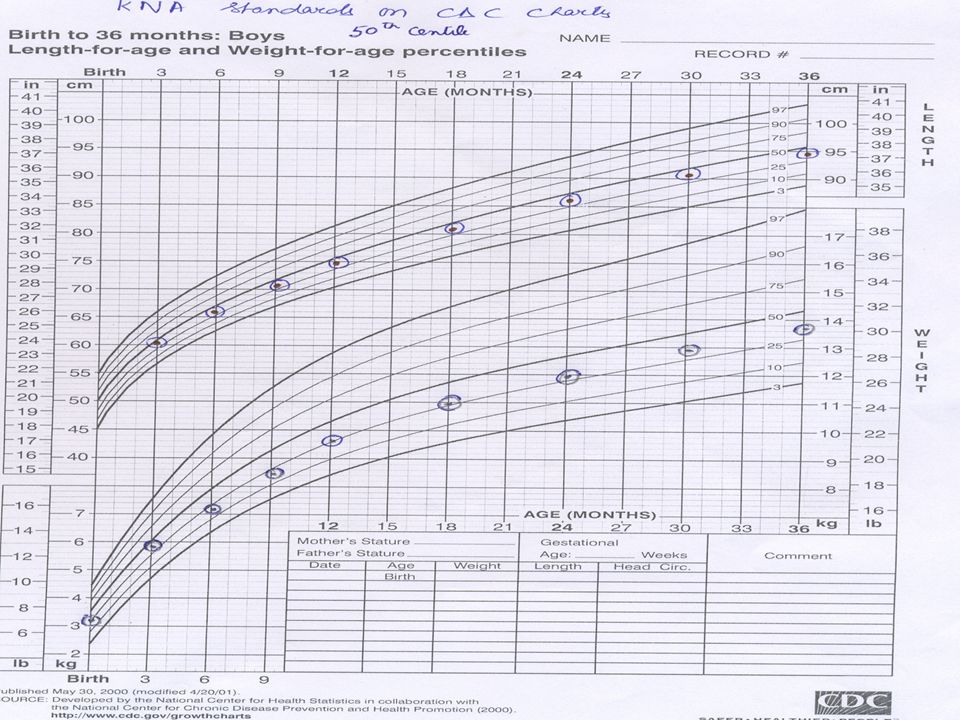
CDC growth charts NCHS growth charts based on growth of American children developed in 1977 Adopted by WHO for international use CDC 2000 growth charts a revised version of earlier NCHS chart: Revision of previous existing 14 charts with introduction of 2 new BMI charts No new primary data collected Used national studies conducted at various times & places and improved statistical tools

24
CDC 2000 growth charts: new features Addition of BMI for age charts: 2 – 20 years Addition of 85 th centile on BMI for age & wt for stature charts Addition of 3 rd & 97 th centiles Limits of length & stature extended on wt for length & wt for stature charts Smoothened percentile curves & Z scores Correction of disjunction that occurred between 24 & 36 months when switching from length to stature in NCHS charts

25
CDC: charts available Birth – 36 months 2 - 20 years 2-5 years Length & weight for age Head circumference for age Weight for length Stature & weight for age BMI for age Weight for stature 2 sets: 3 rd -97 th centile, 5 th – 95 th centile for each sex 85 th centile for BMI for age & wt for stature

26
WHO charts Review of child growth references by WHO expert committee in 1993: NCHS stds do not describe physiologic growth adequately; single country based with many technical /biological drawbacks WHO multi-centric growth reference study undertaken between 1997 – 2003 Primary data collected from 8500 children from Brazil, Ghana, India, Norway, Oman & USA Growth data available for children 0 - 5 years of age

27
Eligibility Criteria for Individuals No health, environmental or economic constraints on growth Mother willing to follow feeding recommendations: Exclusive/ predominant breast feeding for 1 st 4 mths, introduction of complementary feeding by 6 mths Term, single birth Lack of significant perinatal morbidity Non smoking mothers before and after delivery MGRS Study Design and Sample

28
Longitudinal study (birth-24 months) Mothers & newborns screened & enrolled at birth Weight, length, head circumference: 21 times over 24 months Arm circumference: 10 times between 3 and 12 months Skin fold thickness : 6 times between 14 and 24 months
 Mothers & newborns screened & enrolled at birth Weight, length, head circumference: 21 times over 24 months Arm circumference: 10 times between 3 and 12 months Skin fold thickness : 6 times between 14 and 24 months")
29
MGRS Study Design and Sample Cross-sectional survey (18-71 mo) Weight, length, head circumference, arm circumference, skin fold thickness Total sample 8440 children from 6 countries ~300 newborns per site (1743 total) followed up till 24 mo from the longitudinal study ~1400 children per site (6647 total) aged 18-71 mo through the cross sectional surveys
 Weight, length, head circumference, arm circumference, skin fold thickness Total sample 8440 children from 6 countries ~300 newborns per site (1743 total) followed up till 24 mo from the longitudinal study ~1400 children per site (6647 total) aged mo through the cross sectional surveys")
30
WHO charts Available: 0– 5 years Length (birth-2yrs)/height (2-5 yrs) for age Weight for age Weight for length/height BMI for age
/height (2-5 yrs) for age Weight for age Weight for length/height BMI for age")
31
Mean length from birth to 24 months for the six MGRS sites WHO Multicentre Growth Reference Study Group. Assessment of linear growth differences among populations in the WHO Multicentre Growth Reference Study. Acta Paediatr Suppl 2006;450:56-65.

32
Comparison of existing growth charts Data charact Source Study period Population Age-group CDC Multiple different studies 1963-1994 US, mixed feeding, no racial/ethnic diff Birth-20 yrs WHO Primary data 1997-2003 6 Countries pooled data. healthy children & practices Birth-5yrs KNA Primary data 1988-1991 Affluent Indian population, multicentric Birth-18 yrs

33
KNA study vs European & NCHS std

34
KNA study vs other Asian studies

39
Depends upon for what purpose it is used Who will be monitoring the growth? It should be represented by National data The growth charts should be for the entire period of growth from Infancy till full growth potential is achieved Scientifically collected & analyzed multi- centric data Their use should prevent unnecessary referrals Which growth chart to use?

40
Summary WHO growth charts are excellent,recent, up- to- date, multicentric, multinational reference charts Ideal growth chart to be used for children up to 5 yrs of age Drawback is after that age –Which chart to use? Can we use two different charts-one up to 5 yrs and the other for the 6-18 yrs age?

Similar presentations


 Jamai-Osmania (P.O.), Hyderabad.>")


 What is Body Mass Index (BMI)>")
-for-age Growth Charts: A Training for Health Care Providers Adapted by the CHDP Bay Area Nutrition.>")
-for-age Growth Charts: A Training for Health Care Provider Assistants Adapted by the CHDP Bay Area Nutrition Subcommittee.>")


