Download presentation
Presentation is loading. Please wait.

1
Operational NCEP Global Ocean Data Assimilation System: The Link, Validation, and Application Part I Yan Xue, Boyin Huang Climate Prediction Center, NCEP/NOAA David Behringer Environmental Modeling Center, NCEP/NOAA Office of Climate Observation Annual Review Meeting, May 10-11, 2006

2
Seasonal to Interannual Forecasting at NCEP Global Ocean Data Assimilation System (GODAS) Climate Forecast System (CFS) SST XBT TAO AltimeterArgo Scatterometer Stress E-P Heat Fluxes SST Anomaly Forecasters Official SST Forecast Official Probabilistic Surface Temperature & Rainfall Forecasts Seasonal Forecasts for North America CCA, CA Markov CCA, OCN MR, ENSO Ocean Initial Conditions IRI
 Climate Forecast System (CFS) SST XBT TAO AltimeterArgo Scatterometer Stress E-P Heat Fluxes SST Anomaly Forecasters Official SST Forecast Official Probabilistic Surface Temperature & Rainfall Forecasts Seasonal Forecasts for North America CCA, CA Markov CCA, OCN MR, ENSO Ocean Initial Conditions IRI")
3
VALIDATION Dependent Data: TAO temperature profiles World Ocean Atlas 2001 (WOA01) Independent Data: Tide Gauge sea level (Hawaii Sea Level Center) Drifter current velocity (Peter Niiler) Ship-drift velocity (Arthur Mariano) CTD and ADCP velocity from cruises (Gregory Johnson) ADCP velocity from TAO moorings Altimetry sea level
 Independent Data: Tide Gauge sea level (Hawaii Sea Level Center) Drifter current velocity (Peter Niiler) Ship-drift velocity (Arthur Mariano) CTD and ADCP velocity from cruises (Gregory Johnson) ADCP velocity from TAO moorings Altimetry sea level")
5
Drifter CurrentGODAS Current large biases

6
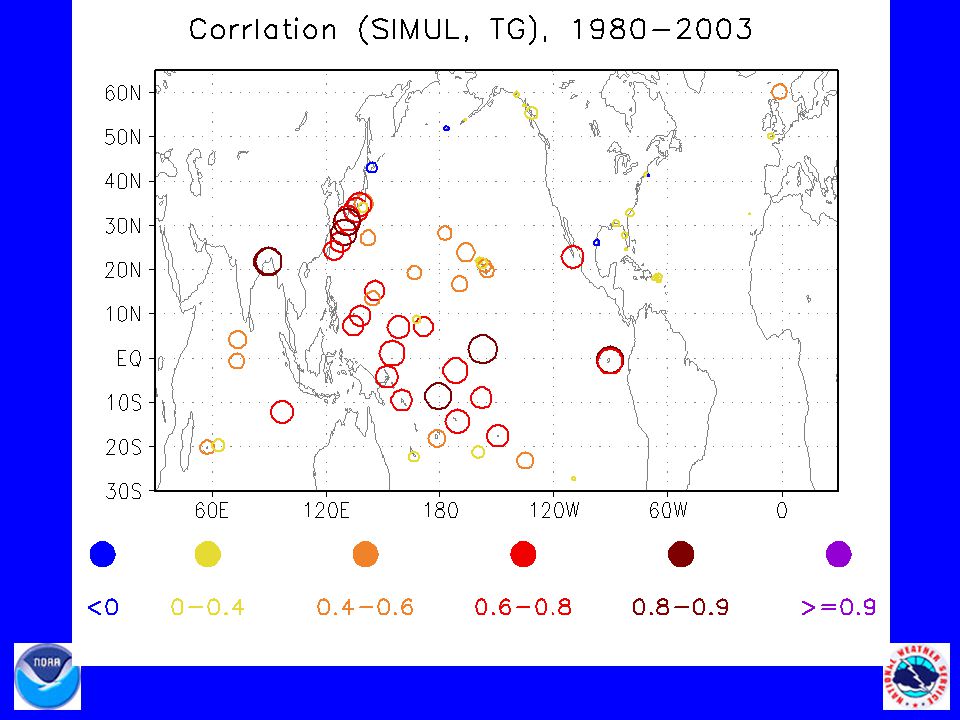
Summary The poor representation of salinity in RA6 has been corrected in GODAS by assimilating a synthetic salinity using local climatological T-S relationship, but the method retains little salinity variability. Surface zonal velocity compares well with surface drifter velocity except in the equatorial Pacific where large biases exist in the western and central Pacific. Equatorial undercurrent is well simulated in the central-eastern Pacific, but poorly simulated in the western Pacific. Correlation with tide gauge observations is about 0.7- 0.9 in tropical Pacific, and 0.4-0.7 in tropical Indian and Atlantic Oceans.

7
GODAS Web Site Objectives: Monitor different aspects of oceanic climate variability Assess benefits of NOAA’s extensive investment in global ocean observing system Disseminate GODAS products to a broad user community Involve research community in assessment and improvement of GODAS NOAA’s Office of Climate Observation sponsors CPC to host a web site for GODAS

8
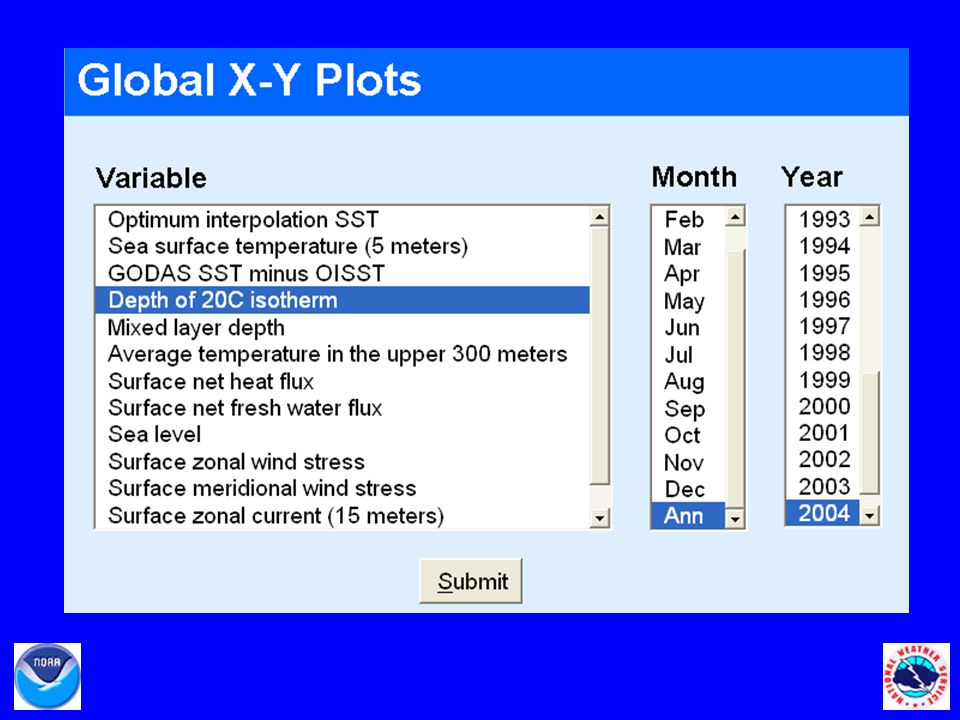
http://www.cpc.ncep.noaa.gov/products/GODAS 1.Pentad products ( archive past 3 months ) Model output ( SST, subsurface temperature, heat content, depth of 20 O C, mixed layer depth, ocean current, wind stress, total heat flux, total fresh water flux ) Model-data intercomparison 2.Monthly products ( archive 1979-current years ) Model output Data distribution Model-data intercomparison 3.Climatology 4.Skill assessment
 Model output ( SST, subsurface temperature, heat content, depth of 20 O C, mixed layer depth, ocean current, wind stress, total heat flux, total fresh water flux ) Model-data intercomparison 2.Monthly products ( archive 1979-current years ) Model output Data distribution Model-data intercomparison 3.Climatology 4.Skill assessment")
12
R2 Zonal StressGODAS D20

13
Operational Applications of GODAS at NCEP Oceanic I.C. for Coupled Climate Forecast System Weekly ENSO Update Climate Diagnostic Bulletin Predictors for Markov and CCA ENSO models Oceanic Kelvin Waves

14
Research Applications of GODAS at NCEP Study annual cycle of tropical Indian Ocean using GODAS products from NCEP, ECMWF and University of Maryland (SODA1.4.2) Study MJO-ENSO connection Study heat content redistribution that is critical for ENSO forecast Study coupled ocean-atmospheric modes in the tropical Indian and Atlantic Ocean and their interactions with ENSO, and use those modes to forecast global tropical SST using a Markov model
 Study MJO-ENSO connection Study heat content redistribution that is critical for ENSO forecast Study coupled ocean-atmospheric modes in the tropical Indian and Atlantic Ocean and their interactions with ENSO, and use those modes to forecast global tropical SST using a Markov model")
15
Eastern Dipole SIO Dome

16
Eastern Dipole SIO Dome

17
Annual Harmonic Dec Jul SepMar

18
Dec Jul SepMar Semi-annual Harmonic

19
Ship-drift NCEP SODA ECMWF

20
NCEP Wyrtki Jet

21
NCEP’s mixed layer depth 5-10 m too deep

22
Summary SODA simulates mean D20 very well except in southern middle latitudes. NCEP has negative biases (5-10 m) in the eastern, south- western Indian Ocean and northern Bay of Bengal. ECMWF has large biases out of the equatorial belt. Annual harmonic of D20 is well simulated by all ocean analyses, which has maximum amplitude in Arabian Sea, western Bay of Bengal, and southern Indian Ocean near 12 o S. Semi-annual harmonic of D20 is well simulated by all ocean analyses except it is underestimated by SODA and ECMWF. Wyrtki jet, dominated by semi-annual harmonic, is well simulated except its strength is too weak. NCEP has too strong westward jet during winter and summer and too weak eastward jet during fall. The annual harmonic is poorly simulated by all ocean analyses. Mean mixed layer depth is well simulated in the equatorial belt except NCEP and ECMWF have positive biases (5-10 m) in the central and eastern Indian Ocean respectively. Biases are generally large out of the equatorial belt.
 in the eastern, south- western Indian Ocean and northern Bay of Bengal. ECMWF has large biases out of the equatorial belt. Annual harmonic of D20 is well simulated by all ocean analyses, which has maximum amplitude in Arabian Sea, western Bay of Bengal, and southern Indian Ocean near 12 o S. Semi-annual harmonic of D20 is well simulated by all ocean analyses except it is underestimated by SODA and ECMWF. Wyrtki jet, dominated by semi-annual harmonic, is well simulated except its strength is too weak. NCEP has too strong westward jet during winter and summer and too weak eastward jet during fall. The annual harmonic is poorly simulated by all ocean analyses. Mean mixed layer depth is well simulated in the equatorial belt except NCEP and ECMWF have positive biases (5-10 m) in the central and eastern Indian Ocean respectively. Biases are generally large out of the equatorial belt..")
23
THANKS!

24
00-05 79-01 00-05

26
Correlation RMS Diff # of pentads

27
SVKW: seasonal variance of Kelvin wave Heat Content averaged in equatorial belt NINO3.4

28
TAO data increases sharply in 1993 XBT data increases sharply in 1990 ARGO data come in in 2000

29
ARGO XBTTAO

31
SIMUL

32
60 O E140 O W30 O W Zonal Velocity Meridional Velocity 10S 10N 30N 30S

33
LEVITUS SIMUL RA6 GODAS too fresh Mean Salinity at 165 o E

34
large biases SIMUL TAO Mean Zonal Velocity

35
RA6 GODAS SIMUL large improvement in Atlantic

36
Assimilate more observations: Altimetry sea level, Argo salinity Reduce forward model errors: MOM4, sea level model Improve ocean data assimilation scheme: Geostrophic balance Argo temp + Argo salinity Argo temp + synthetic salinity Developmental GODAS

38
MJO-related Oceanic Kelvin Waves and the ENSO Cycle: A Study with the NCEP Global Ocean Data Assimilation System Kyong-Hwan Seo and Yan Xue, GRL, 2005

39
GODAS (MOM V.3) Grid: Quasi-global, 40 vertical levels. Physics: KPP boundary layer mixing scheme, free surface. Forcing: Wind stress, heat flux, E-P from Reanalysis 2, surface salinity relaxed to Levitus monthly SSS climatology. Assimilation method: 3D VAR, analyzes temperature and salinity, error covariance varies geographically and temporally. Assimilation data: Temperature profile data from XBTs, profiling floats (Argo), moorings (TAO), synthetic salinity constructed from temperature and local Levitus T-S climatology. RA6 (MOM V.1) Grid: Pacific basin, 27 vertical levels. Physics: Richardson number based scheme, rigid lid. Forcing: combining anomalies from FSU winds with Hellerman and Rosenstein climatology, no E-P flux, no constraint on SSS. Assimilation method: 3D VAR, analyzes temperature only, fixed error covariance prior to TOPEX era. Assimilation data: Temperature profile data from XBTs, profiling floats (Argo), moorings (TAO), TOPEX sea level since 1993.
, moorings (TAO), synthetic salinity constructed from temperature and local Levitus T-S climatology. RA6 (MOM V.1) Grid: Pacific basin, 27 vertical levels. Physics: Richardson number based scheme, rigid lid. Forcing: combining anomalies from FSU winds with Hellerman and Rosenstein climatology, no E-P flux, no constraint on SSS. Assimilation method: 3D VAR, analyzes temperature only, fixed error covariance prior to TOPEX era. Assimilation data: Temperature profile data from XBTs, profiling floats (Argo), moorings (TAO), TOPEX sea level since")
Similar presentations


 at NCEP>")
 Surface Global zonal mean.>")