Download presentation
Presentation is loading. Please wait.

1
Rural Non-Farm Sector Employment in India: Distress Driven or Growth Driven? Vinoj Abraham Centre for Development Studies Trivandrum, kerala INTERNATIONAL CONFERENCE ON EMPLOYMENT OPPORTUNIES AND PUBLIC EMPLOYMENT POLICY IN GLOBALISING INDIA,TRIVANDRUM: 3RD- 5TH APRIL, 2008

2
Background Trends in rural employment Patterns of rural non-farm employment Distress in agriculture and RNFE Determinants of employment in RNFS

3
Background Structural transformation in india’s output but not in employment Transformation in employment and income from agro based rural economy to industry based urban economy is associated with a vibrant RNFS. Performance of RNFS is strongly related to agriculture sector

4
Background A highly productive agriculture sector generates a vibrant RNFS, which is growth driven. A stagnant agriculture sector coexists with a low value adding RNFS that is residual of farm sector. What about INDIA?

5
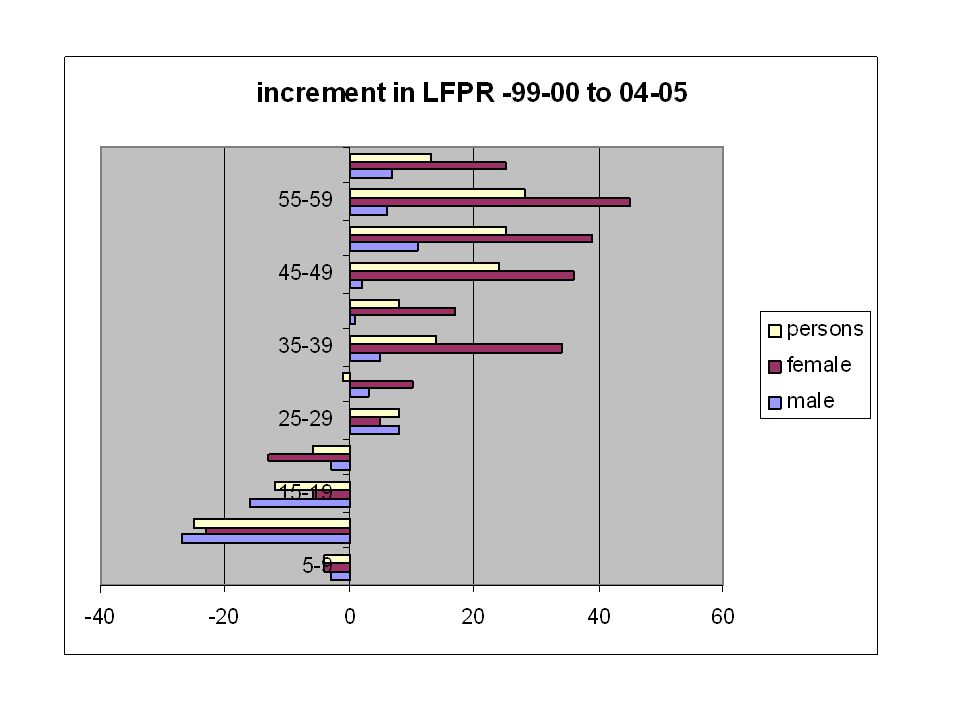
Trends in rural employment Some positive trends in 61 st round NSS Report –Both LFPR and WPR had increased after nearly a decade of jobless growth –Rise of self employment and decline of casualisation –intersectoral mobility of male workers increased

6
Can distress lead to employment increase? –Yes, under certain conditions –When income from the main bread winner of the household does not meet even basic needs then the usually dependent members of household may join Labour force.

7
1.female LFPR, after declining continuously since the peak in 1987-88, rose for the first time in 2004-05 to 24.9 percent. 2.Moreover, this rise is the largest between any two NSS thick rounds, from 23.5 to 24.9 percent

15
RNFS-concepts Rural non- farm sector employment is defined as any form of employment other than farm employment in the type of wage, self, or unpaid family labour. Farm employment is taken to be those agricultural activities such as growing of crops ; market gardening; horticulture ( NIC 011) farming of animals (NIC 012) mixed farming,i.e., both crops and animal farming combined (013); agricultural and animal husbandry service activities (NIC 014); hunting and related services (NIC 015)
 farming of animals (NIC 012) mixed farming,i.e., both crops and animal farming combined (013); agricultural and animal husbandry service activities (NIC 014); hunting and related services (NIC 015).")
16
Data used Household level data of 61st NSSO round on employment-unemployment number of observations -145443 individuals in 62056 households. After cleaning -145359 observations in 62016 households. All tables generated below and the analysis done is based on this dataset.

17
RNFE and Gender Sector of Employment by Gender - Share FemaleMaleTotal Farm employment37.6162.39100 Non-farm employment22.1377.87100 Gender by Sector of Employment - Share FemaleMaleTotal Farm employment72.1855.0260.43 Non-farm employment27.8244.9839.57 100

19
Distress in Farm Sector and Employment Patterns we divide the regions into agriculturally distressed and non-distressed regions GoI (2007) ‘Report of the Expert Group on Agricultural Indebtedness’, Department of Economic Affairs, Ministry of Finance, Government of India, July 100 distressed districts identified by the expert group is the distressed region. Non-distressed is the rest of the region

20
Feminization of work in distressed region

22
Share of workers by status Non-Distress regionDistressed Region FarmNon- farm TotalFarmNon-farmTotal self-employed 38.4539.3538.8129.5539.2933.18 employer 1.910.941.521.720.831.39 unpaid family worker 30.911.0322.9434.9614.8827.47 regular salaried/ wage employee, 1.5927.7912.090.7924.029.45 casual labour: in public works 0.040.590.260.10.840.38 casual labour on other works 27.1120.3124.3932.8820.1528.13 Total100

23
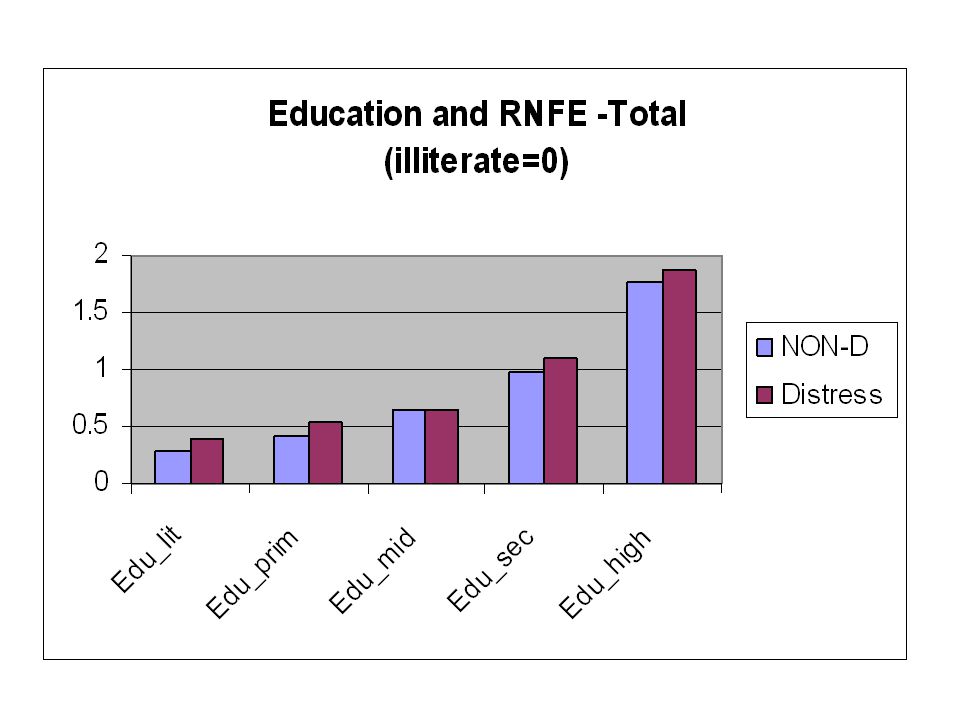
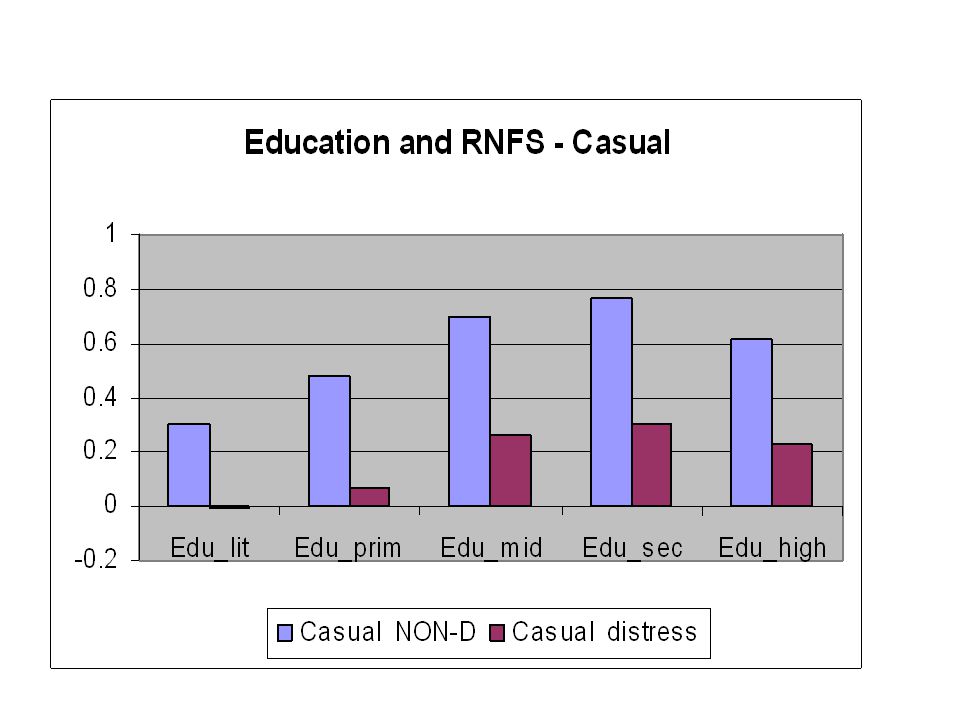
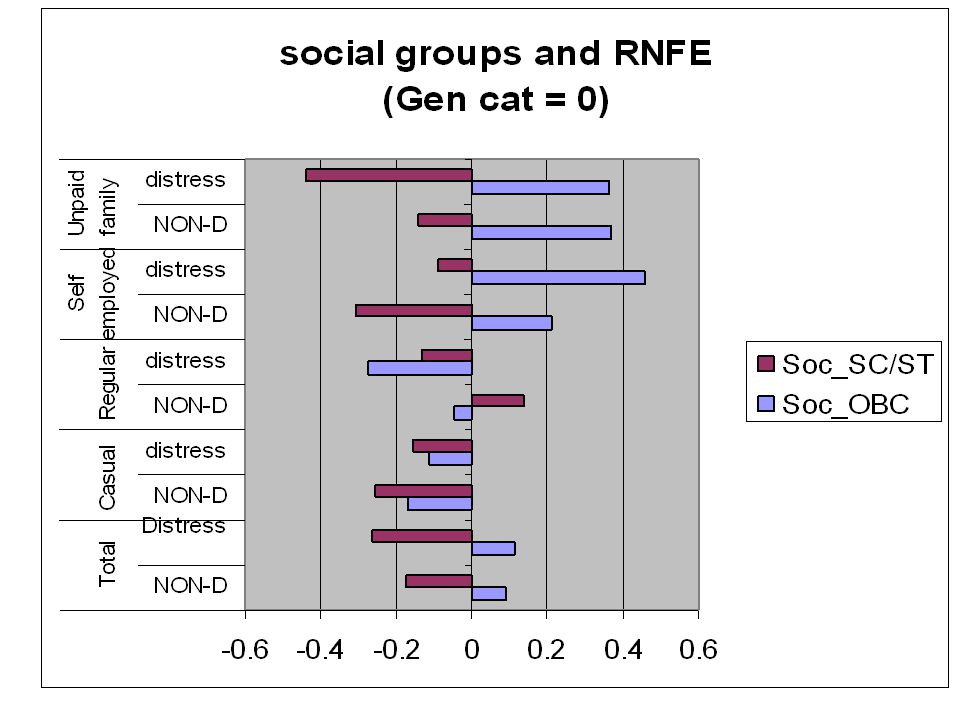
Variables used in the logit model sexfemale =0Male =1, Age Age of the workers age2 Square of age Edu_litIlliterate = 0Not illiterate, but has not attended a formal school Edu_prim Priamry education Edu_mid Middle education Edu_sec Secondary education Edu_high Higher education Percap_landown Average Land owned by a household/no. of persons in the household Percap_landcult Average Land cultivated by a household/no. of persons in the household HH_size Size of the household Soc_OBCGeneral category = 0 Belonging to other backward classes Soc_SC/ST Belonging to other scheduled castes and scheduled tribes

24
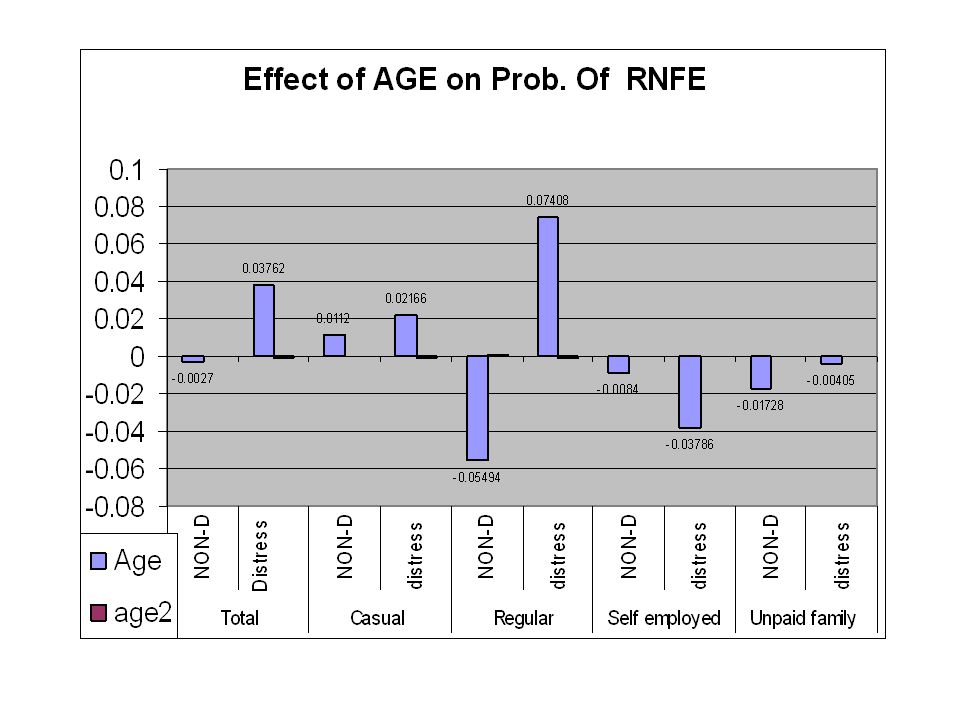
DETERMINANTS OF RNFE LOGIT MODEL Dependent variable –Employed in farm sector = 0 –Employed in non-farm sector =1 The exercise is done for distressed and non- distressed region separately for four category of workers Casual, regular, self employed, unpaid family workers

36
Conclusion Signs of distress related employment growth Employment in non-farm sector picking up probably as a residual sector RNFS Employment in agriculturally distressed regions is related to factors that support residual sector argument, especially in casual wage workers

Similar presentations


, CSO INDIA>")


 - EMPLOYMENT INDICATORS.>")
>")


 Indicators on Employment, Philippines: 1999-2010 (In percent) GOAL 1: ERADICATE EXTREME POVERTY AND HUNGER Target 1.B:>")


